Delia Teresa Sponza1* and Merve Balaban2
1Dokuz Eylül University, Engineering Faculty, Environmental Engineering Department, Buca-İzmir Turkey
2Dokuz Eylül University, Science Institute, Buca-İzmir Turkey
*Address for Correspondence: Delia Teresa Sponza, Dokuz Eylül University, Engineering Faculty, Environmental Engineering Department, Buca-İzmir Turkey, Tel; +009-053-569-327-09; E-mail: delya.sponza@deu.edu.tr
Ping Zhao, School of Chem istry and Chemical Engineering, Guangdong Pharmaceutical University, Education Mega Centre, Guangzhou, 510006, China, E-mail: zhaoping666@163.com
Dates: Submitted: 29 May 2018; Approved: 22 June 2018; Published: 26 June 2018
Citation this article: Sponza DT, Balaban M. Treatment of Olive Mill Effluent by Nano-Zinc Oxide-Magnetite. Am J Nanotechnol Nanomed. 2018; 1(1): 028-042.
Copyright: © 2018 Sponza DT, et al. This is an open access article distributed under the Creative Commons Attribution License, which permits unrestricted use, distribution, and reproduction in any medium, provided the original work is properly cited.
Keywords: Nano-ZnO-Magnetite; Olive mill effluent; Treatment
Abstract
Olive Mill Wastewater (OMW) contains high concentration of organic matter, acidic pH values, suspended solids and high content of phenols and polyphenols which are toxic substances. The aim of this study is the removals of COD, total phenol, Total Solid (TS), total nitrogen, total phosphorus and polyphenols (caffeic acid, tyrosol and hydroxytyrosol) in the OMW by Nano-ZnO-Magnetite composite via adsorption and photocatalytic degradation. The specific objectives of this study are to determine the optimum Nano-ZnO-Magnetite concentration, to evaluate effect of time and pH on the treatment of OMW pollutants for maximum removal of pollutants, and to investigate the recovery of composite.
For photocatalytic degradation under UV, the optimum concentration of Nano-ZnO-Magnetite, irradiation time and pH was determined as 3 gram per liter, 30 minute and 4, respectively. The maximum removal efficiencies of COD, total phenol, TS, total nitrogen and total phosphorus were found as 80, 75, 70, 97 and 85 percent, respectively. And also, the maximum removal efficiencies of caffeic acid, tyrosol and hydroxytyrosol were found as 80, 80 and 51 percent, respectively at Nano-ZnO-Magnetite concentration of 3 gram per liter, at irradiation time of 30 minute and at a UV power of 300 W. When we used the same Nano-ZnO-Magnetite for fifth times for treatment of OMW, the COD, phenol and TS removal efficiencies decreased from 80 to 52 percent, from 75 to 48 percent and from70 to 56 percent, respectively. The total cost to treat 1 liter of raw OMW under UV light was 1.09 €.
Introduction
Olive Mill Wastewater (OMW) management and treatment has been a major issue of environmental concern in the Mediterranean. Olive oil factories, commonly known as olive mills, generate as by-product effluents an average daily amount of 1 m3 of wastewater derived from the washing of the olives, together with more than 10 m3 of wastewater coming from the centrifugation process used for the extraction of the olive oil. OMW is an acidic, dark brown stream consisting of water, organic matter and minerals. In particular, OMW are strong, seasonally generated effluents with a highly diverse organic load that reaches values as high as 220 g/L COD and also contain large amounts of suspended solids up to about 190 g/L. Amongst other organic constituents, OMW contain high concentrations of phenolic compounds up to 10 g/L exhibiting hard non-biodegradable and quite phytotoxic properties [1,2]. It is very difficult to treat the OMW by conventional physicochemical treatment processes. The presence of phytotoxic refractory pollutants, such as phenolic compounds, organic acids, tannins, long chain fatty acids, an organo halogenated contaminants, makes these effluents recalcitrant to biological degradation and thus inhibits the efficiency of biological processes. Moreover, the composition of OMW depends on the extraction process, cultivation parameters, and to the types of the olives [3,4]. Furthermore, OMW inhibits the microbial activity because of the biocidal activity of the aromatic compounds contained. Therefore, there has been an increasing effort for the development of processes capable of purifying OMW [5].
Conventional methods for the removal of phenolic pollutants in OMW can be divided into three main categories: physical, chemical and biological treatment. Among them, physical adsorption method is generally considered to be the best, effective, low-cost and most frequently used method for the removal of phenolic pollutions. Therefore, the utilization of low cost natural and synthetic adsorbents results to the economic treatment of OMW [6].
Advanced Oxidation Processes (AOPs) using UV/H2O2, UV/O3<./sub> or UV/Fenton’s reagent are alternative techniques for the destruction of phenolic compounds and many other organics in wastewater [7]. Fenton and Fenton-like processes was applied on OMW treatment and these processes showed high COD (>80%) and total-phenol (>85%) removal performance [8]. COD, color and suspended solid (SS) from olive OMW was experimentally investigated by using Electro-Coagulation (EC) [9]. Under 30-min retention time, 52% COD was removed by the aluminum anode and the 42% was removed by the iron anode. COD concentrations were 200 mg/L after 10 min contacting time at an aluminum anode power of 10-40 mA/cm2 after 10-min contacting time. The color removal was 90-97% by this process. Sonication was applied on OMW treatment by Oztekin and Sponza [10] and the maximum COD, color, total phenol and Total Aromatic Amines (TAAs) removal efficiencies were obtained 63, 82, 78 and 71%, respectively, at 60°C with sonication only. Photocatalytic oxidation has been extensively used to treat olive-oil mill wastewater [11,12]. In a study, photocatalysis with TiO2 researched for the treatment of diluted OMW. After 24h and in the presence of 1 g l-1 TiO2, almost 22% and 94% of COD and phenols was removed [13].
Semiconductor mediated photocatalysis is a well-developed AOPs, which can be conveniently applied for the complete destruction of phenolic compounds into water and carbon dioxide [14]. Metal oxide semiconductors such as TiO2, ZnO, SnO2, and WO3, etc. have been attempted for the photocatalytic degradation of a wide variety of environmental contaminants [15]. While most of the researchers concentrated on TiO2 as photocatalyst, plenitude of studies have also been focused to explore potential of other metal oxides for the degradation of environmental pollutants [16]. ZnO is better because it absorbs large fraction of the solar spectrum and more light quanta than TiO2 [17]. Researchers have highlighted the performance of ZnO on degradation of some organic compounds [18]. In addition, ZnO has more functions than TiO2 [19]. Recently, researchers have pointed out that ZnO can also be used in the acidic or alkaline conditions through proper treatment [20,21]. Furthermore the optimum pH reported for ZnO process is close to neutral value, whereas the optimum pH for TiO2 mostly lies in acidic region. Hence the ZnO process is more economical for the treatment of industrial effluents. ZnO has been reported to be more efficient than TiO2 in some processes such as the advanced oxidation of pulp mill bleaching wastewater [22], the photooxidation of phenol [23] and photocatalysed oxidation 2-phenyl phenol [24]. In particular, ZnO has attracted much attention with respect to the degradation of various pollutants due to its high photosensitivity, stability and wide band gap. While TiO2 is widely employed as a photocatalyst, ZnO is a suitable alternative to TiO2 as it has a similar band gap energy (3.2 eV) [25], with larger quantum efficiency. Higher photocatalytic degradation efficiencies of contaminant dyes have been reported [26]. Therefore, more study on ZnO catalyst system is necessary.
Recent studies showed that a lot of pollutants in industrial wastewater removed with photodegradation using simultaneous assembly of magnetite and zinc oxide nanoparticles as photocatalyst: Organic compounds like drug can be removed with a yield of 81% using 26 mg/L sepiolite nanoplatform with an assembly of magnetite and zinc oxide nanoparticles as photocatalyst [27]. Organics such as azo dyes was removed with a yield of 80% by photo-fenton degradation a zinc oxide decorated iron oxide/reduced graphene oxide nanocomposite [28]. Multifunctional Fe3O4-ZnO nanocomposites was used to remove 15 mg/L methylene blue with a yield of 79%. [29]. 18mg/L methylene blue was removed using 21 mg/l ZnO Nanoparticles over graphene oxide with photocatalytic degradation at an UV power of 78 W [30]. Deltamethrin in olive mill effluent was removed in aqueous solution using modified magnetic iron oxide nanoparticles [31,32].
The aim of this study is the removals of COD, total phenol, Total Suspended Solid (TS), total nitrogen, total phosphorus and polyphenols (caffeic acid, tyrosol and hydroxytyrosol) in the OMW via photocatalytic processes at increasing Nano-ZnO-Magnetite concentrations (0.5 g/L, 1.5 g/L, 3 g/L, 7 g/L and 10 g/L), at increasing irradiation times (30 min, 60 min, 90 min, 180 min and 240 min) and at increasing pHs (4, 7 and 10). The recovery of the catalyst under optimum operational conditions and the total cost of the treatment were determined.
Theoretical Background
In the last twenty years scientists have developed many ways to understand the mechanism of photocatalysis [7]. Good examples of phocatalysts are solid metal oxides, such zinc oxide and titanium oxide. These substances have relatively high band gaps (Eg ~3.0 eV) and their conductive band edges are more positive potentials than the oxidation potentials needed for many organic contaminants. Once a photon with energy higher than Eg is absorbed by the photocatalyst, it excites the electron from Valence Band (VB) to the Conduction Band (CB).
The corresponding photocatalytic reaction at ZnO surface can be described by the following six steps:
• Adsorption of photons having an energy matches or greater than its band gap energy of ZnO.
• Promotion of an electron e- from the valence band to the conduction band generation a hole h+ in the valence band.
• e- and h+ diffuse and migrate to the surface where they can react.
• Recombination of the electron-hole pairs.
• Stabilization of e- and h+ at the surface to form a trapped electron and a trapped hole respectively.
• Reduction of a suitable electron accepter.
Materials and Methods
Wastewater origin
Raw OMW was taken from an olive mill industry located in Aydın and used without any pre-treatment, in November 2013.
Quartz glass reactors for photocatalytic processes
Photocatalytic degradation experiments were carried out in self-designed quartz glass reactors. The dimensions of the reactors were 38 and 3.5 cm and the constant power of the UV lamps was 300 W. The experiments were performed at room temperature and the pH of the reaction mixture was adjusted from 4 to 7 and 10 using 1 mol/L of H2SO4 and NaOH solution. Photocatalytic experiments were carried out with a known quantity of Nano-ZnO-Magnetite composite varying between 0.5 g/L, 1.5 g/L, 3 g/L, 7 g/L up to 10 g/L at different irradiations times (30 min, 60 min, 90 min, 180 min and 240 min).
And also, photocatalytic degradation experiments were carried out under sunlight in same quartz glass reactors which have the same dimensions. Experiments were carried out at different retention times of the day (3 h, 8 h, 15 h and 24 h) and the reactors were placed at an angle of 90 degrees to the sun. Experiments were carried out at the same Nano-ZnO-Magnetite composite concentrations. The sunlight power was measures as 80 W with a light-meter.
Synthesis of Nano-ZnO-Magnetite composite under laboratory conditions
Nanoparticle is produced under laboratory conditions and immobilization method is used for this purpose. The magnetite sample was ground and sieved to 200-mesh size, then is washed with demineralized water for 3-4 times. The slurry of magnetite was prepared in water and it was stirred for 1 h, kept overnight, filtered under vacuum and the resultant solid cake was exposed to slow evaporation till the completely dry material was obtained. 10 g of magnetite was added to a solution containing 2 g zinc acetate dihydrate dissolved in 250 ml of N,N-dimethyl formamide and the mixture was sonicated for about 3 h in order to obtain homogeneous suspension. To this solution, 100 ml of 0.1 M NaOH/H2O solution was added with constant stirring for 1 h. The nanocomposite powder was obtained after successive centrifugation and dispersions in alcohol and the solid mass was dried at 75°C under vacuum incubator for 4 h. Then it is calcinated at 200°C for 2-3 h in a Muffle furnace. The dried Nano-ZnO-Magnetite nanocomposite was then is used for photocatalytic experimentations.
Analytical methods
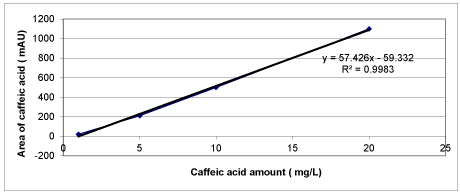
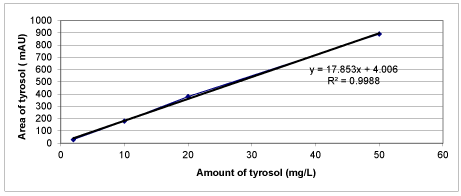
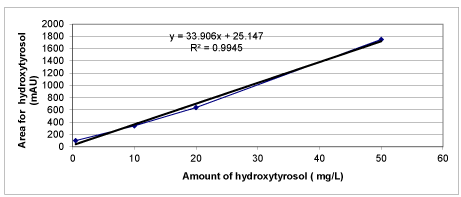
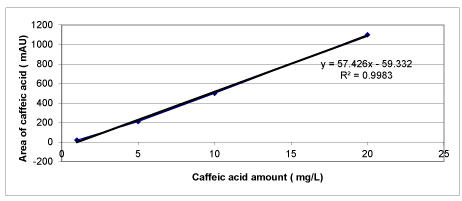
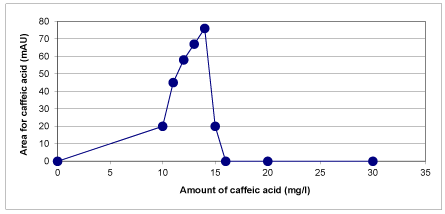
Chemical Oxygen Demand (COD) was determined with Close Reflux Method following the Standard Methods 5220-D [33] using an Aqua mate thermo electron corporation UV visible spectrophotometer. The inert COD and soluble inert COD were measured following the methods proposed by Ekama et al. [34]. The soluble inert COD was measured using the glucose comparison method. In this method, two reactors were feed with the OMW while the third one was feed with glucose. One of the wastewater reactors has the total COD, the second has the total soluble COD, whereas the initial COD in the glucose reactor is adjusted to equal COD value. The researches were performed until all the CODdegradable is consumed, where the COD changes were not detected. The difference between glucose COD and wastewater COD gives the inert COD. The total phenol was determined by using analytical kits (Specturoquant N 1.14551.0001, Merck Chemical Company, Germany) and a NOVA-60 spectrophotometer (Merck). A HPLC Degasser (Agilent 1100), a HPLC Pump (Agilent 1100), a HPLC Auto-Sampler (Agilent 1100), a HPLC Column Oven (Agilent 1100) and a HPLC Diode-Array-Detector (DAD) (Agilent 1100) were used for 3 polyphenol measurements namely caffeic acid, tyrosol and hydroxytyrosol determined in the OMW. About 10 mg of a standard of phenolic acids (caffeic acid, tyrosol and hydroxytyrosol) was weighed accurately and they were dissolved into volumetric flasks containing 10 mL 1:1 MeOH/distilled water to obtain stock solutions. For calibration curves, the stock solution was diluted with 1:4 MeOH/distilled water to obtain the concentration sequence. The linear range and the equations of linear regression were obtained through such a sequence of 50 mg/L, 20 mg/L, 10 and 5 mg/L. Mean areas generated from the standard solutions were plotted against concentration to establish calibration equations. R2 values of calibration graphs of caffeic acid, was found as 0.99 (Figures 1-3).
Total solid was determined with following the Standard Methods 2540-B [33] using an incubator with a temperature of 105°C. A well-mixed sample is evaporated in a weighed dish and dried to constant weight (g/L) in an oven at 103 to 105°C. The differences in weight over that of the empty dish represent the total solids. The total nitrogen and total phosphorous were determined by using analytical kits (Specturoquant N 1.14537.0001 and Specturoquant PO4-P1.14729.0001, Merck Chemical Company, Germany) and a NOVA-60 spectrophotometer (Merck). QC and QA parameters of pollutant parameters measured in the OMW is illustrated in table 1.
| Table 1: QC and QA parameters of pollutant parameters measured in the OMW. | ||||||
| QC and QA values ofthe pollutant parameters | ||||||
| Parameters | uncertainity | accurracy | sensitivity | precision | LOD | Linearity |
| COD | 0,5 mg/L | %100 | %99 | % 99 | 1 mg/L | R2 = 0,999 |
| Phenol | 0,2 mg/L | %100 | %100 | % 100 | 0,5 mg/L | R2 = 0,999 |
| TN | 0,3 mg/L | %100 | %100 | % 100 | 0,1 mg/L | R2 = 0,999 |
| TP | 0,3 mg/L | %100 | %100 | % 100 | 0,1 mg/L | R2 = 0,999 |
| TS | 0,5 mg/L | %100 | %100 | % 100 | 1 mg/L | R2 = 0,999 |
| İnert COD | 0,5 mg/L | %100 | %100 | % 100 | 1 mg/L | R2 = 0,999 |
| Caffeic acid | 0,1 mg/L | %100 | %100 | %100 | 1 mg/L | R2 = 0,999 |
| Hydroxytyrosol | 0,1 mg/L | %100 | %100 | %100 | 1 mg/L | R2 = 0,999 |
| Tyrosol | 0,1 mg/L | %100 | %100 | %100 | 1 mg/L | R2 = 0,999 |
Instrumental characterization
X-ray Diffraction (XRD): XRD measurements were carried out with the RIGAKU D‐Max 2200 PC. X-ray diffraction were used for the identification of crystalline materials and their structure. Each crystalline solid has its unique characteristic X-ray powder pattern and can be used for the characterization of crystalline properties of materials. Preliminarily, the material was characterized, X-ray crystallography may be used to determine the atom distribution in the crystalline structure and the distance between atoms and angles [35].
Fourier Transform Infrared (FT-IR): FTIR spectra were determined using an Perkin Elmer System with a Spectrum of BX. Fourier Transform Infrared Spectroscopy (FTIR) is a technique which is used to obtain an infrared spectrum of absorption, emission, photoconductivity or Raman scattering of a solid, liquid or gas. FTIR spectrometer catch resolution with high spectrum data. This advantage of the spectrometer cause determining the intensity of wavelengths [36].
Scanning Electron Microscope (SEM): The morphological and structural observation was made on a scanning electron microscope VegaII/LMU (Tescan, CzechRepublic). SEM is a microscope using the extra high-energy electrons to prepared sample. The examined area is irradiated with a finely focus ion beam, which can scan the sample in a raster scan pattern. Information about the sample’s surface topography, composition, and other properties such as electrical conductivity is obtained from the signals produced through the interaction between the electrons and atoms. The types of signals produced contain backscattered electrons, secondary electrons, characteristic x-rays, specimen current, transmitted electrons and photons of various energies [37].
Recovery of Nano-ZnO-Magnetite photocatalyst: After first use the Nano-ZnO-Magnetite nanoparticles were filtered after photocatalytic degradation, washed three times by water and ethanol and dried at 75°C. Five sequential treatment steps were investigated in order to detect the effect of recovery of Nano-ZnO-Magnetite based on significant removal yields of COD, phenol and TS under UV irradiation.
Results and Discussion
Characterization of OMW
The average total inert COD, soluble inert COD, COD, phenol, total solids, total nitrogen and total phosphorous contents of the raw olive mill effluent were 117000 mg/L, 660 mg/L, 84250 mg/L, 330 mg/L and 890 mg/L, respectively, while its average pH value was 3.5- 4.5 (Table 2). The samples were stored at room temperature and shaken well before all the experiments.
| Table 2: Characterization of OMW | ||||||
| CODinert (mg/L) | Soluble CODinert (mg/L) |
COD (mg/L) | Phenol (mg/L) | Total Solids (mg/L) | Total Nitrogen (mg/L) | Total Phosphorous (mg/L) |
| 8765 ± 50 | 3674±50 | 117.000 ± 800 | 660 ± 20 |
|
330 ± 20 | 890 ± 20 |
Physicochemical properties of Nano-ZnO-Magnetite
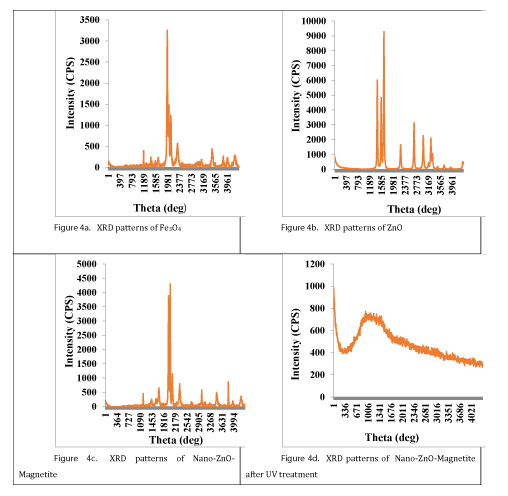
X-Ray Diffraction (XRD) analysis results: XRD was used to verify the chemical composition and the crystal structure of Fe3O4 and ZnO nanoparticles and Nano-ZnO-Magnetite nanocomposites [38]. Figure 4 shows X-Ray Diffraction (XRD) patterns of the Fe3O4, ZnO, Nano-ZnO-Magnetite and Nano-ZnO-Magnetite after treatment. As it is shown in figure 4a, 4b and 4c the XRD peaks can match well with peaks of Fe3O4, ZnO and Nano-ZnO-Magnetite. Figure 4c represents the XRD pattern of Nano-ZnO-Magnetite core/shell. Considering this figure, it is shown that after coating, we have enhancement in peak intensity which is caused by overlapping of Fe3O4 peaks [39]. No peaks corresponding to the impurities are detected, indicating that Fe3O4-ZnO heterostructure were formed during the photodegradation process [40]. After UV irradiation, Fe3O4/ZnO nanocomposites have an amorphous structure as illustrated in figure 4d. An amorphous or non-crystalline solid is a solid that lacks the long-range order characteristic of a crystal [41].
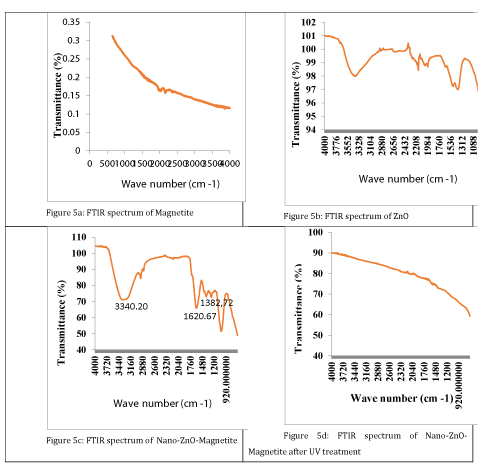
Fourier Transform Infrared (FTIR) analyses results: Figure 5 shows the FT-IR spectra of Fe3O4, ZnO, Nano-ZnO-Magnetite and Nano-ZnO-Magnetite after UV treatment. It can be seen that the characteristic absorption of Fe-O bond is at 582.78/cm and 620.21/cm, while that of -OH bond is at 3449.26/cm. The absorptions at 1395.25/cm and 1591.29/cm are special peaks of the COO-Fe bond. This bond appeared via the hydroxide groups on the outer layer of the magnetite [42]. These peaks reveal that Fe3O4 has been successfully immobilized onto the surface of ZnO. Combining the XRD results, it can be concluded that ZnO had been coated on the Fe3O4, successfully. From figure 5d, it can be seen that the pollutants in wastewater binds to the surface of Nano-ZnO-Magnetite composite after UV irradiation Therefore, crystal form of Nano-ZnO-Magnetite composite converts the amorphous shape. As a result, the peak number in the Nano-ZnO-Magnetite composite decreases in the amorphous shape.
Determination of optimum Nano-ZnO-Magnetite concentration under UV light
In this step of this study the pollutants in the OMW were treated via photodegradation under UV light power in the presence of a nano composite (Nano-ZnO-Magnetite) generated under laboratory conditions. In the photocatalytic treatment when Nano-ZnO-Magnetite is illuminated with the light of UV, electrons are promoted from the valence band to the conduction band of the semiconducting oxide to give electron-hole pairs. The valence band (hVB+) has a positive energy to form hydroxyl radicals on the surface Nano-ZnO-Magnetite and the conduction band (eCB-) has a negative energy to reduce the molecular oxygen. The hydroxyl radical is a powerful oxidizing agent and attacks organic pollutants present at or near the surface of Nano-ZnO-Magnetite. This phenomenon causes photooxidation of pollutants such as COD, phenol, total solids, total nitrogen and total phosphorous in the OMW resulting in destructing of them [43].
The mechanism of photodegradation of COD, phenol, total solids, total nitrogen and total phosphorous on Nano-ZnO-Magnetite nanocomposite surface was as follows: The excitation of Nano-ZnO-Magnetite nanocomposite by UV energy leads to the formation of an electron-hole pair. The hole combines with water (H2O) to form hydroxyl radicals (OH∙) while electron converts oxygen (O2) to superoxide radical (O2∙−), a strong oxidizing species as shown in the following equations [10]:
Nano-ZnO-Magnetite + hv ↔ Nano-ZnO-Magnetite nanocomposite + hVB+ + eCB− (1.0)
Nano-ZnO-Magnetite + hv ↔ Nano-ZnO-Magnetite (hVB+ + eCB−) (2.0)
Nano-ZnO-Magnetite | OH− + hVB+ → Nano-ZnO-Magnetite | OH∙ (3.0)
Nano-ZnO-Magnetite | OH2 + hVB+ → Nano-ZnO-Magnetite | OH∙ + H+ (4.0)
Nano-ZnO-Magnetite | OH∙ + Redorg → Oxorg → photodegradation of OMW pollutants (5.0)
hVB+ + Redorg → Oxorg → photodegradation of OMW pollutants (6.0)
OH∙ + OH∙ → H2O2 (7.0)
H2O2 (or 2OH∙) → 2H+ + O2 (8.0)
Effects of 0.5 g/L, 1.5 g/L, 3 g/L, 7 g/L and 10 g/L Nano-ZnO-Magnetite concentrations on the removals of COD, phenol, total solids, total nitrogen and total phosphorous in the OMW were studied with constant irradiation time (30 min) at an original pH of OMW (pH: 4.60) at a temperature of ± 20°C with UV lamps with powers of 300 W (Figures 6-9).
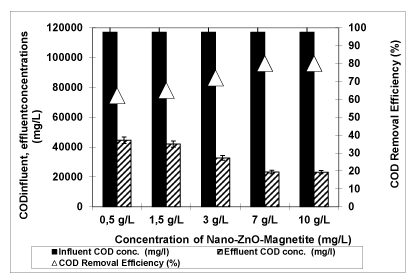 Figure 6: The effect of Nano-ZnO-Magnetite concentration on COD yield (Influent Conc.: 117000 mg/L, T: ± 20°C, pH: 4.60, Irradiation time 30 min, UV power: 300 W)
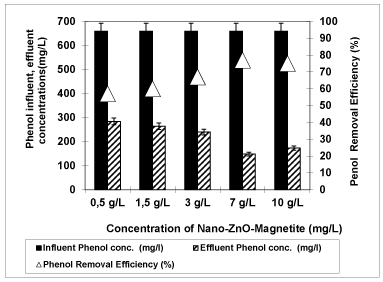 Figure 7: The effect of Nano-ZnO-Magnetite concentration on phenol yield (Influent Conc.: 660 mg/L, T: ± 20°C, pH: 4.60, Irradiation time 30 min, UV power: 300 W).
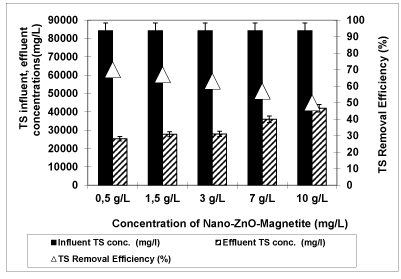 Figure 8: The effect of Nano-ZnO-Magnetite concentration on TS yield (Influent Conc.: 84250 mg/L, T: ± 20°C, pH: 4.60, Irradiation time 30 min, UV power: 300 W)
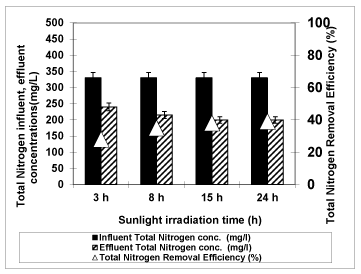 Figure 9: The effect of Nano-ZnO-Magnetite concentration on total nitrogen yield (Influent Conc.: 330 mg/L, T: ± 20°C, pH: 4.60, Irradiation time 30 min, UV power: 300 W).
The effect of the concentration of Nano-ZnO-Magnetite nanocomposite on the COD removal was studied as shown in figure 6. The photodegradation efficiency increases with an increase in the amount of Nano-ZnO-Magnetite photocatalyst from 0.5 g/L up to 7 g/L. COD photodegradation efficiencies were found as 62 %, 65%, 72% and 80% for 0.5 g/L, 1.5 g/L, 3 g/L and 7 g/L Nano-ZnO-Magnetite nanocomposite concentrations, respectively, at a pH of 4.60 at a temperature of ± 20°C after 30 min irradiation time with an UV lamp having a power of 300 W. Further increase of Nano-ZnO-Magnetite photocatalyst concentration to 10 g/L did not affect the COD yield. On the other word, the addition of higher quantities of Nano-ZnO-Magnetite photocatalyst would have no effect on the photodegradation efficiency of the pollutants in the OMW. This can be explained as follows: The structure of photocatalysts decomposed and the pore surfaces of Nano-ZnO-Magnetite was covered completely with the pollutant parameters and the radical species. Low photocatalyst quantity decreases the number of active sites on the Nano-ZnO-Magnetite surface, which in turn decreases the numbers of hydroxyl (OH∙) radicals [10].
Figure 7 shows the degradation efficiency of phenol with increasing of Nano-ZnO-Magnetite photocatalyst concentrations from 0.5 g/L, to 1.5 g/L, 3 g/L, 7 g/L and to 10 g/L at a pH of 4.60 at a temperature of ± 20°C after 30 min irradiation time with an UV lamp with a power of 300 W. When the concentration of Nano-ZnO-Magnetite increased from 0.5 g/L to 1.5 g/L, 1.5 g/L to 3 g/L from 3 g/L to 7 g/L, the removal efficiency of phenol increased from 57% to 60%, from 60% to 67%, from 67% to 77%, respectively. When Nano-ZnO-Magnetite photocatalyst concentration further increased up to 10 g/L, the phenol yield slightly decreased to 75%. The maximum phenol removal was obtained as 77% at 7 g/L Nano-ZnO-Magnetite composite concentration. The enhanced photocatalytic activity of Nano-ZnO-Magnetite (Fe3O4) possibly can be attributed to the retardation of recombination of electron-hole pair as reported by Hong et al. [45] at 7 g/L Nano-ZnO-Magnetite composite concentration found that the photoemission intensity of the Nano-ZnO-Magnetite composite is lower than that of ZnO, indicating a slower electron-hole recombination in the Nano-ZnO-Magnetite composite (44 olacak). This is probably due to the presence of Fe3+ ions in Nano-ZnO-Magnetite composite. It has been reported that Fe3+ ions in Fe3O4 can act as a photo-excited electron-trapping site to prevent the fast recombination of photo induced charge carriers and prolonged life-times. In this study, the photo-generated electron in the conduction band of ZnO might be captured by the Fe3+ ions. This would lead to the formation of reduced iron ions, Fe2+, which are relatively unstable in comparison with Fe3+. The Fe2+ ions further react with the oxygen dissolved in the reaction mixture of OMW to generate Fe3+ ions. A similar phenomenon has been observed in Fe-doped TiO2 and ZnO by various researcher [46]. The presence of Fe3+ also has been suggested as a trigger for the enhanced photocatalytic activity.
Figure 8 shows the photodegradation efficiencies of TS at increasing Nano-ZnO-Magnetite photocatalyst concentrations of 0.5 g/L, 1.5 g/L, 3 g/L, 7 g/L and 10 g/L. The photocatalytic yields were found as 70%, 66%, 63%, 57% and 50%, respectively, at a pH of 4.60 at a temperature of ± 20 0C after 30 min irradiation time with an UV lamp with a power of 300 W. It was found that the percentage photodegradation efficiency decreased with increase in initial concentration of the Nano-ZnO-Magnetite composite from 0.5 g/L to 10 g/L. Thus could be attributed to the increase of concentration gradient and saturation of adsorption and photocatalytic points in the presence of high Nano-ZnO-Magnetite composite. The maximum TS removal efficiency is 70% at 0.5 g/L Nano-ZnO-Magnetite photocatalyst concentration. Magnetite (Fe3O4) nanoparticles are easily subject to aggregation in aqueous system. Fe3O4 nanoparticles exhibit the hydrophilic surface due to presence of hydroxyl groups. There is hydrophilic interaction between particles and these particles form the agglomerate and resulted in large clusters [47]. The agglomerates may cause to increase TS removal efficiency.
Figure 9 summarizes the effects of increasing Nano-ZnO-Magnetite photocatalyst concentrations (0.5 g/L, 1.5 g/L, 3 g/L, 7 g/L and 10 g/L) on total nitrogen photodegradation yields at a pH of 4.60 at a temperature of ± 20°C after 30 min irradiation time with an UV lamp with a power of 300 W. According to the aforementioned Nano-ZnO-Magnetite photocatalyst concentrations the photodegradation yields of total nitrogen were 79%, 75%, 70%, 66% and 54%, respectively. As the Nano-ZnO-Magnetite photocatalyst concentrations were increased, the photodegradation yields of total nitrogen decreased as TS parameter in the OMW. Further increase in catalyst concentration from 0.5 g/L up to 10 g/L reduces the specific activity of the catalyst because of agglomeration of catalyst particles and light scattering and screening effect, thus leading to the decreased photocatalytic degradation efficiency. On the other hand, at high catalyst concentration, could not be obtained a homogeneous suspension. The results with a reduced photocatalytic activity. So the photodegradation efficiency of total nitrogen decreases gradually as reported by Mulinacci et al. [48]. This could be attributed to the increasing of turbidity of the OMW suspension. This resulting in decreasing of UV light and power a result of excess of Nano-ZnO-Magnetite particles.
From figure 10 it can be seen that when the concentration of Nano-ZnO-Magnetite increased from 0.5 g/L to 1.5 g/L, 1.5 g/L to 3 g/L from 3 g/L to 7 g/L, from 7 g/L to 10 g/L, the removal efficiency of total phosphorous increased from 37% to 45%, from 45% to 52%, from 52% to 66% and from 66% to 85%, respectively, at a pH of 4.60 at a temperature of ± 20°C after 30 min irradiation time with an UV lamp with a power of 300 W. The maximum total phosphorous removal was obtained as 85% at 10 g/L Nano-ZnO-Magnetite composite concentration. This high yield can be attributed to the irradiation of an aqueous Nano-ZnO-Magnetite suspension with light energy greater than the band gap energy of the semiconductor (hv > Eg = 3.2 eV) conduction band electrons (e-) and valence band holes (h+) are generated as reported by Pirkanniemi and Sillanpaa [49]. After this primary event, a part of the photo generated carriers recombine in the bulk of the semiconductor with heat emission while the rest of the electron carriers reach to the surface of Nano-ZnO-Magnetite containing the holes plenty with electrons and reaction products, respectively. The electrons performed during photocatalysis react with the molecular O2 adsorbed on the Nano-ZnO-Magnetite surface reducing it to O-2 anion, while the holes under UV light can oxidize the OH- ions and the H2O molecules adsorbed at the Nano-ZnO-Magnetite surface to produce OH. radicals [49]. Given above based on the explanations OH. radicals degraded total phosphorus pollutants from olive mill wastewater. With increasing Nano-ZnO-Magnetite composite concentration, more surface area of Nano-ZnO-Magnetite is generated and the more OH. radicals are formed, phosphorus removal efficiency increases.
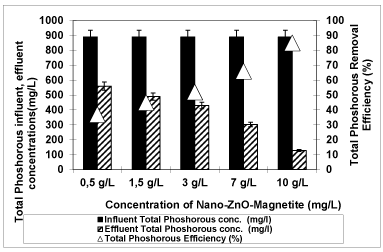 Figure 10: The effect of Nano-ZnO-Magnetite concentration on total phosphorous yield (Influent Conc.: 890 mg/L, T: ± 20°C, pH: 4.60, Irradiation time 30 min, UV power: 300 W)
Considering all the removal efficiencies for studied parameters in the OMW, a significant nanocomposite concentration was obtained for maximum yields throughout photoxidation of pollutant parameters in the OMW. The optimum Nano-ZnO-Magnetite composite concentration was selected as 3 g/L for the maximum removals of all pollutant parameters in the OMW via photocatalysis.
Determination of optimum ırradiation time of uv light: Figures 11-15 illustrated the effect of the irradiation time on the removal of COD, phenol, TS, total nitrogen and total phosphorous in the OMW throughout photocatalysis, respectively at a pH of 4.60 at a temperature of ±20°C at constant 3 g/L Nano-ZnO-Magnetite composite concentration with an UV lamp with a power of 300 W. As aforementioned in the upper section, the optimum Nano-ZnO-Magnetite composite concentration was found as 3 g/L. Therefore, the effects of irradiation times on the COD, phenol, TS, total nitrogen and total phosphorous removal efficiencies were investigated at five different adsorption times (30 min., 60 min., 90 min., 180 min. and 240 min) at a pH of 4.60 at a temperature of ± 20°C at constant 3 g/L Nano-ZnO-Magnetite composite concentration with an UV lamp with a power of 300 W.
Figure 11 illustrates the removal of COD with different irradiation times (30 min., 60 min., 90 min., 180 min. and 240 min) at a pH of 4.60 at a temperature of 20°C after at a 3 g/L concentration of Nano-ZnO-Magnetite nanocomposite. The maximum removal of COD was observed at 30 min irradiation time with a maximum yield of 80 %. COD removal efficiencies were found as 80 %, 80%, 69%, 65% and 62% for 30 min., 60 min., 90 min., 180 min. and 240 min irradiation time, respectively. The removal efficiencies decreased as the irradiation time was increased from 30 min to 240 min in the OMW, under UV light. The reduction of yield could be due to the formation of small colorless metabolite organic molecules which, at least temporarily, remain in the solution, for instance ethanol, glycerol and simple sugars which can be considered as degradation intermediates [50]. El- Hajjouji et al. [50] was investigated the UV/TiO2 treatment of olive mill wastewater and reported only 22% removal efficiency of COD after 24 h UV irradiation.
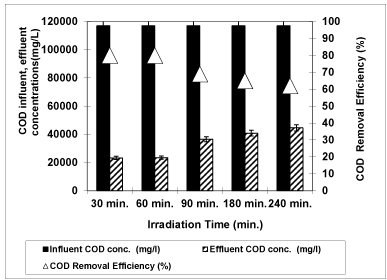 Figure 11: The effect of Irradiation time on COD yield (Influent Conc.: 117000 mg/L, T: ± 20°C, pH: 4.60, Nano-ZnO-Magnetite concentration: 3g/L, UV power: 300 W).
The reduction of COD can be summarized as follows [50]:
Step 1: COD + UV → partially oxidized species
Step 2: partially oxidized species + UV→ CO2 + H2O + inorganic salts
Figure 12 shows the effect of different UV irradiation times (30 min., 60 min., 90 min., 180 min. and 240 min) on photodegradation of phenol at a pH of 4.60 at a temperature of 20 0C after at a 3 g/L concentration of Nano-ZnO-Magnetite nanocomposite with an UV lamp with a power of 300 W. From figure 13 it can be seen that as the irradiation time were increased from 30 min, to 60 min, to 90 min, and to 180 min, the phenol yield increased from 57%, to 63%, to 65%, to 77%, and stabilized to 77%. Further increase of adsorption time to 240 min did not increase the phenol yield. The optimum irradiation time can be considered as 180 min for the maximum removal efficiency of phenol (77%). Similar results were found by Feng et al. [51] in the presence of Fe3O4-ZnO. The percentage of degradation of phenol was 65.5% under UV light after 150 min irradiation time. The phenol degradation was only 52% when pure ZnO was used, which is lower than that in the presence of either Fe3O4-ZnO.
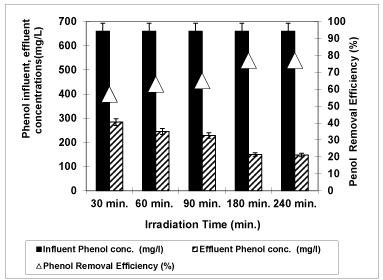 Figure 12: The effect of Irradiation time on phenol yield (Influent Conc.: 660 mg/L, T: ± 20°C, pH: 4.60, Nano-ZnO-Magnetite concentration: 3g/L, UV power: 300 W).
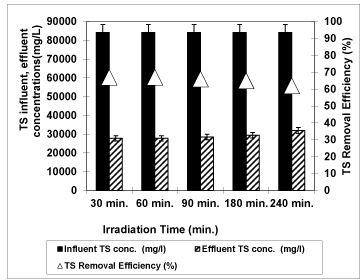 Figure 13: The effect of Irradiation time on TS yield (Influent Conc.: 84250 mg/L, T: ± 20°C, pH: 4.60, Nano-ZnO-Magnetite concentration: 3g/L, UV power: 300 W).
Semiconductors like Nano-ZnO-Magnetite absorb a photon taking a certain amount of energy and then are transferred from electron band to conductive band. Meanwhile, an electron vacancy forms and joins the redox reaction with the absorbed substance, by transmigrating to the electron and vacancy catalyst surface.
TS removal efficiencies were observed versus UV irradiation times such as 30 min., 60 min., 90 min., 180 min. and 240 min at an original pH of OMW (pH: 4.60) at 3g/L Nano-ZnO-Magnetite and at a temperature of ± 20°C with an UV lamp with a power of 300 W as shown from figure 13. After 30 minutes irradiation times the TS yield reached 67%. The removal efficiency of TS decreased from 67% to 66%, to 65% and to 62% with the increasing the irradiation time from 30 min to 60 min, to 90 min, to 180 min and 240 min, respectively. This TS yield decreased slightly to 62% after 240 min irradiation times. Long irradiation times affect negatively the removal efficiency of TS. The optimum irradiation time was found to be 30 min for 67% TS efficiency. These results showed that the photocatalysis of TS in the OMW was not dependent to irradiation time. Badawya et al. [52] found that the TS removal efficiency for UV/TiO2 was 48.9% after 80 min irradiation time.
Figure 14 shows the photodegradation efficiency of total nitrogen with increasing of irradiation times 30 min., 60 min., 90 min., 180 min. and 240 min at an original pH of OMW (pH: 4.60) at 3g/L Nano-ZnO-Magnetite and at a temperature of ± 20°C with an UV lamp with a power of 300 W. When the irradiation time increased from 30 min to 60 min, from 60 min to 90 min, from 90 min to 180 min, from 180 min to 240 min, the removal efficiency of total nitrogen decreased from 79% to 75%, from 75% to 70%, from 70% to 68% and decreased from 68% to 65%, respectively. For maximum yield of total nitrogen, the optimum irradiation time was found to be 30 min. Uğurlu and Karaoğlu [53] observed that 25.0 mg/L of TiO2 was enough for the 65% removal of the total nitrogen after an irradiation time of 50 min.
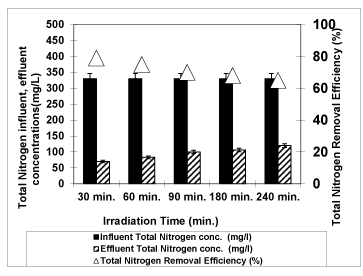 Figure 14: The effect of Irradiation time on total nitrogen yield (Influent Conc.: 330 mg/L, T: ± 20°C, pH: 4.60, Nano-ZnO-Magnetite concentration: 3g/L, UV power: 300 W).
As shown in figure 15, the photodegradation of total phosphorous decreases from 66% to 64%, to 55%, to 52%, to 50% along increasing of irradiation times from 30 min. to 60 min., to 90 min., to 180 min. and to 240 min at an original pH of OMW (pH: 4.60) at 3g/L Nano-ZnO-Magnetite and at a temperature of ± 20°C with an UV lamp with a power of 300 W. Experiments on the photodegradation have shown that high irradiation time has negatively affected the total phosphorous removal efficiency. The maximum efficiency is 66% for 30 min irradiation time. After that the total phosphorus yields decreased.
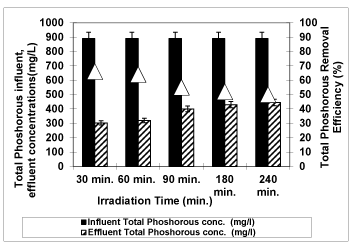 Figure 15: The effect of Irradiation time on total phosphorous yield (Influent Conc.: 890 mg/L, T: ± 20°C, pH: 4.60, Nano-ZnO-Magnetite concentration: 3g/L, UV power: 300 W).
Optimum irradiation time was selected as 30 min because photooxidation equilibrium was reached within 30 min for maximum yields in all OMW parameters. Considering the economical needs, shortening the time of pollutant photodegradation is a necessary goal in this century. The maximum yields should be obtained as short as photodegradation yields.
Effects of pH on the of removal OMW throughout photodegradation under UV light: It is well understood that the adsorption capacity of Nano-ZnO-Magnetite concentration on photocatalyst is a key factor for the degradation efficiency in the photocatalytic oxidation process. Generally, it is observed that the efficiency of decomposition of organics over the photocatalyst is more pronounced if large number of target molecules is adsorbed on the catalyst surface, which either depends on the acidic/basic nature of the surface of the catalyst or surface modifications through change in pH of the system [54].The variations in removals of COD and phenol using 3 g/L Nano-ZnO-Magnetite concentrations under acidic (pH 4), neutral (pH 7) and alkaline (pH 10) pH’s at a temperature of ± 20°C after 30 min irradiation time with an UV lamp with a power of 300 W were given in figures 16 and 17 respectively.
From figure 16, it is evident that the maximum removal of COD was observed at pH 4 at a temperature of 20 °C after 30 min irradiation time at a 3 g/L concentration of Nano-ZnO-Magnetite concentration which this pH is the original pH level of OMW. When the initial pH was increased from 4 to 7 and 10, the COD removal efficiencies decreased from 80% to 78% and 69%. The maximum removal of COD was 80% at pH 4.60 at a temperature of 20°C after 30 min irradiation time at a 3 g/L concentration of Nano-ZnO-Magnetite with an UV lamp with a power of 300 W. In the beginning of the photooxidation, liquid phase compounds responsible for COD are adsorbed by colliding with the surface of the colloidal Nano-ZnO-Magnetite photocatalyst. Covalent bonds are formed between adsorbate particles and the adsorbent surface where multiple activated centers were exist on the surface of nano-composite [55]. The reduction of COD efficiency may results.
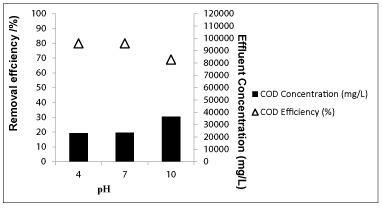 Figure 16: The effect of pH on COD yield (Influent Conc.:117000 mg/L, T: ± 20°C, Nano-ZnO-Magnetite conc.: 3g/L, Irradiation time: 30 min, UV power: 300 W).
When the pH of OMW was increased from 4 to 7 and 10, the removal efficiency of phenol increased from 63% to 72% and 75%, respectively, at a temperature of 20°C after 30 min irradiation time at a 3 g/L concentration of Nano-ZnO-Magnetite concentration with an UV lamp with a power of 300 W (Figure 17). It is observed that under basic conditions, the amount of phenol degraded is considerably higher as compared to acidic medium. These observations can be ascribed to two phenomenon: (a) Under acidic condition, surface of the nanocomposite is positively charged at both nano ZnO and Magnetite sites that leads to the protonation of active sites and therefore, affects the adsorption of phenol moiety. Moreover, the protonation of phenol occurring under this condition also hindered the adsorption of phenol thereby affecting its removal. (b) The influence of higher pH can be attributed to two processes occurring on the surface of the nanocomposite and phenol. Firstly, the magnetite surface becomes alkaline in nature thus enhancing the adsorption capacity while the nano sized ZnO surface undergoes surface modification resulting in the formation of negatively charged species. Both these features are responsible for cooperative action of simultaneous adsorption followed by photo degradation of phenol on the surface of Nano-ZnO-Magnetite nanocomposite. Secondly, phenol undergoes deprotonation under highly alkaline condition that also enhances rate of adsorption on the Nano-ZnO-Magnetite nanocomposite throughout photocatalysis [57]. It is seen that maximum phenol removal happens on pH 10. The reason can be explained with the fact that tannin, lignin and other polymeric substances may transform into phenol metabolites and degraded with photocatalytic oxidation as reported by Ugurlu and Karaoglu [53].
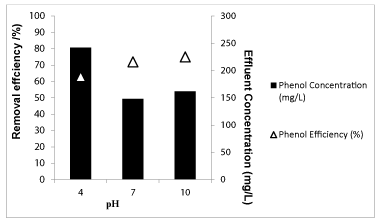 Figure 17: The effect of pH on phenol yield (Influent Conc.:660 mg/L, T: ± 20°C, Nano-ZnO-Magnetite conc.: 3g/L, Irradiation time: 30 min, UV power: 300 W)
Measurements of polyphenols
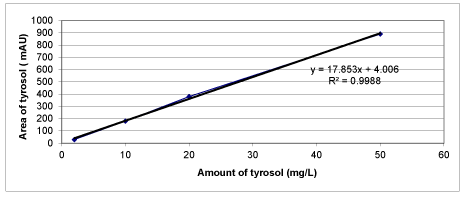
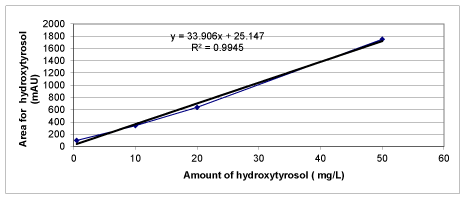
Calibration graphs were plotted for the three polyphenols (caffeic acid, tyrosol and hydroxytyrosol) illustrated in figures 18-20, respectively. They will be used for making measurements on HPLC analysis. For each of a phenolic compound has been studied four different concentrations (1 mg/L, 10 mg/L, 20 mg/L and 50 mg/L) for drawing calibration graphs. R2 values of calibration graphs of caffeic acid, tyrosol and hydroxytyrosol was found as 0.99, 0.99 and 0.99, respectively (Figures 18-20).
Measurement of the concentration of phenolic compounds by HPLC in raw OMW
The concentrations of the phenolic compounds identified in the raw sample of OMW were determined quantitatively. HPLC technique was used to identify and quantify the caffeic acid, tyrosol and hydroxytyrosol phenolic compounds contained in the raw OMW. For this purpose, a standards mixture solution of phenolic compounds was analysed. Sample concentrations were calculated, based on peak areas compared to those of each of the external standards. The phenolic compounds were identified by their retention times in comparison with external standards [56,57]. As a result of this analysis, tyrosol and hydroxytyrosol were measured at λ = 280 nm and caffeic acid was measured at λ = 320 nm. Figure 21 shows that 7.07 mg/L concentration of caffeic acid has been found in raw OMW as a result of HPLC measurements. El-Hajjouj et al. [13] have found a close result to our study. They studied that the analysis of the amount of polyphenols in the olive mill wastewater and the amount of caffeic acid were found as 5.7 mg/L. In another study was performed by Mulinacci et al. [48] and similar results are reported. 4 mg/L concentration of caffeic acid was found in OMW.
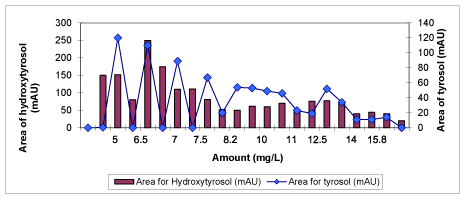
According to the results of chromatograms in HPLC analysis, 112.6 mg/L concentration of hydroxytyrosol and 172.7 mg/L concentration of tyrosol was identified in raw OMW illustrated in figure 22. In a study investigated by Anandan et al. [58] polyphenols were analyzed in the olive oil mill effluents. 115.9 mg/L and 50.3 mg/L concentration of hydroxytyrosol and tyrosol were found, respectively, and these data are consistent with our results.
The results showed that hydroxytyorosl and tyrosol were most abundant phenolic compounds in OMW (Figure 22). Hydroxytyrosol and caffeic acid show a powerful antioxidant activities [58] Hydroxytyrosol inhibits human LDL oxidation, inhibits platelet aggregation and exhibits anti-inflammatory and anticancer properties [56]. The caffeic acid also was found in OMW samples, but at very low concentrations (Figure 21). Obied et al. [59] reported that caffeic acid shows a higher antioxidant activity than hydroxytyrosol. Tyrosol showed similar concentrations with hydroxtytrosol in the OMW (Figure 22). Samuel et al. [60] reported that hydroxtytrosol is very effective in preserving cellular anti-oxidant defenses.
Measurement of the concentration of phenolic compounds by HPLC in treated OMW with Nano-ZnO-Magnetite under UV irradiation
By using 3 g/L Nano-ZnO-Magnetite nanocomposite with 30 min irradiation time at pH 4 and a temperature of ± 20°C with an UV power of 300 W during photooxidation, the concentration of caffeic acid decreased from 7.07 mg/L to 1.47 mg/L (4,00184e-1) (Figure 23) and the caffeic acid yields were recorded as 80% (Table 3). Vana et al. [61] investigates the adsorption of the phenolic compounds caffeic acid on PAC (powdered activated carbon) and TiO2, as well as their degradation via direct photocatalysis. 90% removal of caffeic acid was obtained within 0.5 h of UV exposure time at PAC concentration of 0.45 g/L while in our study, 80% removal of caffeic acid efficiency was found with 30 min UV irradiation time at a 3 g/L Nano-ZnO-Magnetite nanocomposite concentration.
| Table 3: Removal Efficiencies of polyphenols (caffeic acid, tyrosol and hydroxytyrosol) in OMW. | |||
| Polyphenols | Raw OMW (mg/L) | Treatment of OMW with UV photooxidation(mg/L) | Removal Efficiency (%) |
| Caffeic acid | 7.07 | 1.47 | 80 |
| Tyrosol | 172.7 | 34.8 | 80 |
| Hydorxytyrosol | 112.6 | 55.2 | 51 |
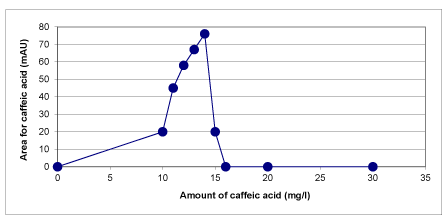 Figure 23: The concentration of caffeic acid found in treated OMW with UV photo oxidation (Nano-ZnO-Magnetite concentration: 3 g/L, T: ± 20°C, pH: 4.60, UV irradiation time: 30 min, UV power: 300 W).
And also, the removal efficiencies of tyrosol and hydroxytyrosol were obtained as 80% and 51%, respectively. Their concentrations decreased from 172.7 mg/L to 34.8 mg/L for tyrosol and from 112.6 mg/L to 55.2 mg/L for hydroxytyrosol, respectively, after treatment with 3 g/L Nano-ZnO-Magnetite nanocomposite under 300 W UV irradiation after 30 min irradiation time (Figure 24, Table 3).
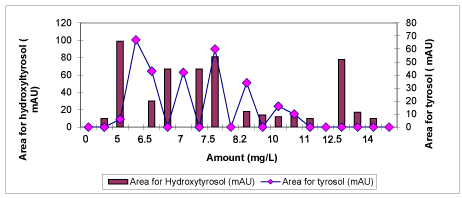 Figure 24: The concentration of tyrosol and hydroxytyrosol found in treated OMW with UV photooxidation.
No more studies were found in the recent literatures containing the photocatalytic oxidation of olive mill effluent using Nano-ZnO-Magnetite composite:
The treatability of OMW by the combination of photocatalytic oxidation, using two nanomaterials as TiO2 and Fe2O3 catalysts. Photocatalytic oxidation was carried out using different systems, nano-TiO2/UV, nano-Fe2O3/UV, nano-TiO2/H2O2/UV and nano-Fe2O3/H2O2/UV. Color, COD, total phenolic content was reduced to 43%, 14%, and 38% with 15 mg/L nano TiO2- Fe2O3 under 60 W UV power after 29 min irradiation [62]. The combination with a biological treatment increased the reduction of COD and and the phenolic content of olive mill effluent [62]. The photocatalytic degradation of two phenolic compounds, p-coumaric acid and caffeic acid, was performed with a suspended mixture of TiO2 and powdered activated carbon (PAC) at pH = 3.4 and at 365 nm UV lamps. 87% removal of total polyphenols, 58% of COD, was achieved after 24 h of exposure to 365 nm irradiation in the presence of a suspended mixture of TiO2 by 50% [63]. The study performed by Uğurlu and Karaoğlu [53] focuses on the photocatalytic degradation of olive mill wastewater (OMW) with TiO2/Sepiolite nanoparticle, by using Ultraviolet (UV). The photocatalytic degradation of lignin and phenol was favorable (79%) at pH 9–11.00 at 0.25 mg/L nanoparticle at 80°C. Total phenol, color and COD yields were 61%, 67% and 45% with 12 mg/L magnetic nanoparticles after 50 min of irradiation in an olive mill based wastewater [64].
UV absorption spectra of OMW
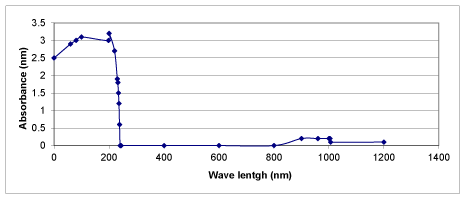
The UV-visible spectra of the OMW were recorded on a spectrophotometer in the wave lengths changing from 190 nm to 1100 nm. UV absorption spectra of raw OMW and treated OMW with UV light were illustrated in figures 25 and 26, respectively. The maximum absorbances were recorded at between 2600 and 4000 at wavelength between 180 nm and 380 nm in raw OMW. When OMW were irradiated under UV light with 3 g/L Nano-ZnO-Magnetite nanocomposite, spectral changes were observed (Figure 25). The maximum absorbances decreased close to zero after UV treatment. The reason of this can be explained by the production of polyphenols namely caffeic acid, tyrosol and hydroxytyrosol after photodegradation of OMW.
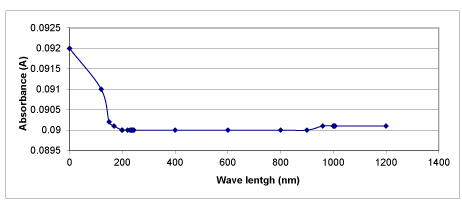 Figure 26: Change in UV absorption spectra in the treated OMW under UV irradiation (Nano-ZnO-Magnetite concentration: 3 g/L, pH: 4.60, UV irradiation time: 24 h, UV power: 300 W).
Inert Chemical Oxygen Demand (COD) levels in the OMW
In this study, in order to determine inert fractions of olive mill wastewaters batch experimental studies were carried out. This analysis is important for modelling, design and operation of olive mill wastewater treatment systems and determination of discharge limits. Experimental study conducted on three parallel batch reactors operated with wastewater sample for 41 days until the COD and glucose levels were stabilized and a plateau was observed with unchanged COD concentrations during consecutive 7 days.
Figure 27 shows the total inert COD and soluble inert COD fractions of raw OMW. Total inert COD and dissolved inert COD of OMW tests were performed. As a result after the inert COD of glucose reached close to zero, the total inert COD of raw OMW was found as 8765 mg/L. The soluble inert COD of raw OMW was found as 3674 mg/L, respectively.
Figure 28 illustrated the total inert COD and soluble inert COD fractions of treated OMW at an original pH at a temperature of 20°C after 30 min irradiation time at a 3 g/L concentration of Nano-ZnO-Magnetite with an UV lamp with a power of 300 W. After treatment with 300 W UV, the total inert COD and soluble inert COD concentrations of OMW obtained as 694 mg/L and 395 mg/L, respectively.
 Figure 28: Total inert COD and dissolved inert COD of treated with UV irradiation of OMW (T: ± 20°C, Nano-ZnO-Magnetite conc.: 3g/L, Irradiation time: 30 min, UV power: 300 W, pH: 4.60).
The resulting total inert COD and soluble inert COD of OMW removal efficiency via photocatalytic treatment was found to be 92% and 89%, respectively as shown in table 4.
| Table 4: Removal Efficiencies of total inert COD and soluble inert COD of OMW. | |||
| Parameter | Raw OMW (mg/L) |
Treatment of OMW with UV (mg/L) | Removal Efficiency (%) |
| Total Inert COD | 8765 | 694 | 92 |
| Soluble Inert COD | 3674 | 395 | 89 |
Determination of recovery of Nano-ZnO-Magnetite
The main handicap in applying photocatalytic processes for the reclamation of industrial effluents relies in the cost of the catalyst. In this sense, the difficulty in recovering the catalyst poses the main technical-economical drawback. In order to provide the catalyst reuse, a novel photocatalyst with magnetic properties containing Fe2O3 was produced under laboratory conditions to remediate the OMW. Magnetic separation provides a very convenient approach for removing and recycling magnetic particles (such as magnetite) by applying external magnetic fields. The addition of Fe2O3 into ZnO nanoparticle enhances the separation and reuse of nano ZnO-Magnetite nanocomposites [63,64]. The evolution of COD, phenol and TS degradation rates were determined.
From table 5 it can be clearly seen that the utilization of Nano-ZnO-Magnetite composite first, second, third, fourth and fifth times, the removal efficiency of COD decreased from 80% to 75%, to 70%, to 64% and to 52%, respectively. Likewise, the removal efficiency of phenol was decreased from 75% to 68%, to 62%, to 54% and to 48%. The TS removal efficiency also decreased from 70% to 63%, to 59%, to 57% and to 56%, respectively. After first, second, third, fourth and fifth times utilization of the same Nano-ZnO-Magnetite composite. Although in this study very high recovery yields were not obtained this partly reduce the cost spending for nanocomposite.
| Table 5: Recovery of Nano-ZnO-Magnetite (T: ±20 – 30 0C, Nano-ZnO-Magnetite Concentration: 3 g/L, UV irradiation time: 24 h, UV power: 300 W, pH: 4.60) | |||||
| Parameters | First Treatment | SecondTreatment | Third Treatment | Forth Treatment | Fifth Treatment |
| COD | 80% | 75% | 70% | 64% | 52% |
| Phenol | 75% | 68% | 62% | 54% | 48% |
| TS | 70% | 63% | 59% | 57% | 56% |
Cost analysis
Cost analysis for 1 liter treatment of OMW under UV light was shown in table 6. Considering all the removal efficiencies for studied parameters in the OMW, the optimum Nano-ZnO-Magnetite composite concentration was found as 3 g/L for the maximum removals of all pollutant parameters in the OMW via photocatalysis. Electricity, UV lamp and Nano-ZnO-Magnetite composite was used for treatment of OMW. All the consumptions were calculated and are given in Table 6. Total cost of the treatment of 1 liter OMW was obtained as 1.09 €. 0.2 TL was spent for 20 UV lamps, while the chemical cost and nanocomposite cost were only 2.01 TL for 1 liter OMW treatment.
| Table 6: Cost Analysis of treatment OMW under UV light. | |
| Cost Analysis | Treatment of OMW under UV light |
| UV | 1 UV lamp: 25 TL 20 UV lamp: 20 * 25 = 500 TL / 1000 h = 02 TL |
| Electricity consumption | 24 hour UV irradiaition: 0.12 TL |
| Chemicals | Magnetite(Fe3O4)(1 kg): 2.99 € Zincacetate monohydrate (500 g): 8.40 € N,N-dimethylformamide(DMF) (1 lt): 1.52 € |
| Cost analysis for treatment of 1 liter OMW: 3 g Nano-ZnO-Magnetitewas used for treatment of 1 liter OMW under UV light. 10 gmagnetite, 2 g Zinc acetate monohydrate and 250 mL N,N-dimethylformamide(DMF)was used for prepare 3 g Nano-ZnO-Magnetite. |
For 3 g Nano-ZnO-Magnetite: 10g magnetite:0.1299 € (0.3935 TL) 2g Zinc acetate monohydrate: 0.3136 € (0.95 TL) 250mL N,N-dimethylformamide (DMF): 0.25 €(1.1 TL) |
| Total cost for treatment of 1 liter OMW | 0.2 TL + 0.12 TL + 0.3935 TL + 0.95TL + 1.1 TL = 2.76 TL = 1.09 € |
| The cost of chemicals is calculatedaccording to market prices. Electricity costs are calculated according to theconsumer price industrial units. Recent euro exchange rate was used toconvert the Euro currency Turkey (1€ = 3.03TL). | |
Conclusions
The results of this study showed that the maximum removal efficiencies of COD, total phenol, TS, total nitrogen and total phosphorus were found as 80, 75, 70, 97 and 85 percent, after photocatalytic treatment with 3 g/L ZnO-Magnetite concentration after 30 min. irradiation time at a UV power of 300 W, respectively. The maximum removal efficiencies of caffeic acid, tyrosol and hydroxytyrosol were high under optimum operational conditions given above. The Nano-ZnO-Magnetite was reused with yields (79 and 76%) after two and third times sequential treatment of OMW. The total cost to treat 1 liter of raw OMW under UV light was 1.09 €.
Acknowledgements
The autors thanks to TÜBİTAK-Turkish National Scientific Resaerch Foundation fot it’s financial support.
References
- Mantzavinos D, Kalogerakis N. Treatment of olive mill effluents. Part I: organic matter degradation by chemical and biological processes-an overview. Environ Int. 2005; 31: 289-295. https://goo.gl/rxj22E
- Komilis DP, Karatzas E, Halvadakis CP. The effect of olive mill wastewater on seed germination after various pretreatment techniques. J Environ Manage. 2005; 74: 339-348. https://goo.gl/DZWqHX
- Nieto LM, Hodaifa G, Rodriguez S, Gimenez JA, Ochando J. Degradation of organic matter in olive-oil mill wastewater through homogeneous Fenton-like reaction. Chem Eng Jour. 2011; 173: 503-510. https://goo.gl/2ugKLa
- Niaounakisand M, Halvadakis CP. Olive-mill waste management - Literature review and patent survey. Typothito-George Dardanos, Athens. 2004.
- Roig A, Cayuela ML, Sanchez-Monedero MA. An overview on olive mill wastes and their valorisation methods. Waste Manag. 2006; 26: 960-969. https://goo.gl/AoEo6o
- Roostaei N, Tezel FH. Removal of phenol from aqueous solutions by adsorption. J Environ Manage. 2004; 70: 157-164. https://goo.gl/omyg65
- Chen GH, Lei LC, Yue PL. Wet oxidation of high concentration reactive dyes. Industrial and Engineering Chemistry Research. 1999; 38: 1837-1843. https://goo.gl/vE5VFa
- Kiril Mert B, Yonar T, YaliliKilic M, Kestioglu K. Pre-treatment studies on olive oil mill effluent using physicochemical, fenton and fenton-like oxidations processes. J Hazard Mater. 2010; 174: 122-128. https://goo.gl/EGKqBo
- İnan H, Dimoglo A, Şimşek H, Karpuzcu M. Olive oil mill wastewater treatment by means of electro-coagulation. Separation and Purification Technology. 2004; 36: 23-31. https://goo.gl/bZzzbY
- Oztekin R, Sponza DT. Treatment of wastewaters from the olive mill industry by sonication. Journal of Chemical Technology and Biotechnology. 2013; 88: 212-225. https://goo.gl/tJCz42
- Marques PASS, Rosa MF, Mendes F, Collares Pereira M, Blanco J, Malato S. Wastewater detoxification of organic and inorganic toxic compounds with solar collectors. Desalination. 1996; 108: 213-220. https://goo.gl/DkX96Y
- Sharma A, Rao P, Mathur RP, Ameta SC. Photocatalytic reactions of xylidineponceau on semiconducting zinc oxide powder. J Photochem Photobiol A: Chemistry. 1995; 86: 197-200. https://goo.gl/rQwt3x
- El-Hajjouji H, Barje F, Pinelli E, Baily JR, Richard C, Winterton P, et al. Photochemical UV/TiO2 treatment of olive mill wastewater (OMW). Bioresour Technol. 2008; 99: 7264-7269. https://goo.gl/uLeYYz
- Lathasree S, NageswaraRao A, SivaSankar B, Sadasivam V, Rengaraj K. Heterogeneous photocatalytic mineralisation of phenols in aqueous solutions. Journal of Molecular Catalysis A: Chemical. 2004; 223: 101-105. https://goo.gl/mdD1sd
- Oppenlander T. Photochemical purification of water and Air- Wiley-VCH, Weinheim. 2003. https://goo.gl/LuSyBY
- Daneshvar N, Salari D, Khataee AR. Characteristics and photocatalytics activities of Ce-Doped ZnO nanoparticles. Journal of Photochemistry and Photobiology. 2004; 162: 317. https://goo.gl/dzHZqj
- Sakthivel S, Neppolian B, Shankar MV, Arabindoo B, Palanichamy A, Murugesan V. Solar photocatalytic degradation of azodye: comparison of photocatalytic efficiency of ZnO and TiO2. Solar Energy Materials and Solar Cells. 2003; 77: 65-82.
- Kobayakawa K, Sato C, Sato Y, Fujishima A. Continuous-flow photoreactor packed with titanium dioxide immobilized on large silica gel beads to decomposeoxalic acid in excess water. Journal of Photochemistry & Photobiology A: Chemistry. 1998; 118: 65-69. https://goo.gl/FWJCcp
- Kamat PV. Photochemistry on nonreactive and reactive (semiconductor) surfaces. Chemical Reviews. 1993; 93: 267. https://goo.gl/vsgFLN
- Comparelli R, Fanizza E, Curri ML, Cozzoli PD, Mascolo G, Agostiano A. UV-induced photocatalytic degradation of azo dyesby organic capped ZnOnanocrystals immobilized onto substrates. Applied Catalysis B: Environmental. 2005; 62: 144-149. https://goo.gl/RgaC4d
- Fouad OA, Ismail AA, Zaki ZI, Mohamed RM. Zinc oxidethin films prepared by thermal evaporation deposition and its photocatalytic activity. Applied Catalysis B: Environmental. 2006; 62: 144-149. https://goo.gl/gN36Vp
- Yeber MC, Roderiguez J, Freer J, Baeza J, Duran NH, Mansilla D. Advanced oxidation of a pulp mill bleaching wastewater. Chemosphere. 1999; 39: 1679-1688. https://goo.gl/UqB24c
- Khodja AA, Sheili T, Pihichowski JF, Boule P. Photocatalytic degradation of 2-phenylphenol on TiO2 and ZnO in aqueous suspensions. Journal of Photochemistry and Photobiology A. 2001; 141: 231-239. https://goo.gl/9C3y9w
- Serpone N, Maruthamuthu P, Pichat P, Pelizzetti E, Hidaka H. Exploiting the interparticle electron-transfer process in thephotocatalyzed oxidation of phenol, 2-chlorophenol and pentachlorophenol-chemical evidence for electron and hole transfer between coupled semiconductors. Journal of Photochemistry and Photobiology A: Chemistry. 2001; 85: 247-253. https://goo.gl/9ZaHSX
- Sakthivel S, Shankar MV, Palanichamy M, Arabindoo B, Murugesan V. Photocatalytic decomposition of leather dye Comparative study of TiO2 supported on alumina and glass beads. Journal of Photochemistry & Photobiology A: Chemistry. 2002; 148: 153-159. https://goo.gl/ppdrVn
- Dindar S, Icli J. Unusual photo reactivity of zinc oxide irradiated by concentrated sunlight. Journal of Photochemistry and Photobiology A: Chemistry. 2001; 140: 263. https://goo.gl/9MjZ1W
- Akkari P, Aranda P, Mayoral A, Gracia-Hernandez M, Ruiz-Hitzky E, Ben Haj Amara A. Sepiolite nanoplatform for the simultaneous assembly of magnetite and zinc oxide nanoparticles as photocatalyst for improving removal of organic pollutants. Journal of Hazardous Materials. 2017; 340: 281-290. https://goo.gl/eB2cNX
- Ojha Prashad D, Kumar Joshi M, Joo Kim H. Photo-Fenton degradation of organic pollutants using a zinc oxide decorated iron oxide/reduced graphene oxide nanocomposite, Ceramics International. 2017; 43: 1290-1297. https://goo.gl/uJNdqv
- Goyal P, Chakraborty S, Misra KS. Multifunctional Fe3O4-ZnO nanocomposites for environmental remediation applications. Environmental Nanotechnology, Monitoring & Management. 2018; 10: 28-35. https://goo.gl/1xrkvA
- Zarrabi R, Haghighi M, Alizadeh R. Sonoprecipitation dispersion of ZnO nanoparticles over graphene oxide used in photocatalytic degradation of methylene blue in aqueous solution: Influence of Irradiation Time and Power, Ultrasonic Sonochemistry. 2018; 45: 234-245. https://goo.gl/BnaJQn
- Ghafari B, Moniri E, Panahi HA, Karbassi A, Najafpour S. Study on non-linear equilibrium, kinetics and thermodynamic of deltamethrin removal in aqueous solution using modified magnetic iron oxide nanoparticles. Water Sci Technol. 2017; 76: 847-858. https://goo.gl/mkV1U4
- Ghafari B, Moniri E, Panahi HA, Karbassi A, Najafpour S. Efficient removal of Deltamethrin from polluted aquatic media by modified iron oxide magnetic nanoparticles. Desalination and Water Treatment. 2017; 59: 304-311. https://goo.gl/QBm7F1
- APHA-AWWA-WEF. Water and wastewater treatment methods. USA. 2005.
- Ekama GA, Dold PL, Marais GV. Procedures for determining influent COD fractions and the maximum specific growth-rate of heterotrophs in activated sludge systems. Water Science and Technology. 1986; 18: 91-114. https://goo.gl/KUtUNr
- Ma P, Xiao C, Li L, Shi H, Zhu M. Facile preparation of ferromagnetic alginate-g-poly (vinyl alcohol) microparticles. European Polymer Journal. 2008; 44: 3886-3889. https://goo.gl/9QptUw
- Griffiths P, de Hasseth JA. Fourier transform infrared spectrometry (2nd Ed.). Wiley-Blackwell. ISBN 0-471-19404-2. 2007.
- Badawy MI, El Gohary F, Ghaly MY, Ali ME. Enhancement of olive mill wastewater biodegradation by homogeneous and heterogeneous photocatalytic oxidation. J Hazard Mater. 2009; 169: 673-679. https://goo.gl/7Tzmmc
- Hasanpour A , Niyaifar M, Asan M. Synthesis and Characterization of Fe3O4 & ZnO Nanocomposites by Sol- Gel Method, Proceedings of the 4th International Conference on Nanostructures. 2012; (ICNS4) 12-14 March, Kish Island, I.R. Iran.
- Nikazar M, Alizadeh M, Lalavi R, Rostami MH. The optimum conditions for synthesis of Fe3O4/ZnO core/shell magnetic nanoparticles for photodegradation of phenol. J Environ Health Sci Eng. 2014; 12: 21. https://goo.gl/ZQApbs
- Vohra M.S, Selimuzzaman SM, Al-Suwaiyan MS. NH4+ -NH3 removal from simulated wastewater using UV-TiO2 photocatalysis: effect of co-pollutants and pH. Environmental Technology. 2010; 31: 641-654.
- Yu J, Xiang Q, Zhou M. Preparation, characterization and visible-light-driven photocatalytic activity of Fe-doped titania nanorods and first-principles study for electronic structures. Applied Catalysis B: Environmental. 2009; 90: 595-602. https://goo.gl/r6hh5E
- Nassar NN. Iron oxide nanoadsorbents for removal of various pollutants from wastewater: an overview. A. Bhatnagar (Ed.), Application of Adsorbents for Water Pollution Control, Bentham Science Publishers. 2012.
- Gouvea CAK, Wypych F, Moraes SG, Duran N, Nagata N, Peralta-Zamora P. Semiconductor-assisted photocatalytic degradationof reactive dyes in aqueous solution. Chemosphere. 2000; 40: 433-440.
- Hong RY, Zhang SZ, Di GQ, Li HZ, Zheng Y, Ding J, et al. Preparation, characterization and application of Fe3O4/ZnO core/shell magnetic nanoparticles. Materials Research Bulletin. 2008; 43: 2457-2468. https://goo.gl/BA9gfj
- Ambrus Z, Balazs N, Alapi T, Wittmann G, Sipos P, Dombi A, et al. Synthesis, structure and photocatalytic properties of Fe(III)-doped TiO2 prepared from TiCl3. Applied Catalysis B: Environmental. 2008; 81: 27-37. https://goo.gl/i7tsE2
- Ba-Abbad MM, Kadhum AA, Mohamad AB, Takriff MS, Sopian K. Visible light photocatalytic activity of Fe3+-doped ZnO nanoparticle prepared via sol–gel technique. Chemosphere. 2013; 91: 1604-1611. https://goo.gl/b6wLBQ
- Teja AS, Koh PY. Synthesis, properties, and applications of magnetic iron oxide nanoparticles. Progress in Crystal Growth and Characterization of Materials. 2009; 55: 22-45. https://goo.gl/WjJSp5
- Mulinacci N, Romani A, Galardi C, Pinelli P, Giaccherini C, Vincieri FF. Polyphenolic content in olive oil waste waters and related olive samples. J Agric Food Chem. 2001; 49; 3509-3514. https://goo.gl/gVsK7b
- Pirkanniemi K, Sillanpaa M. Heterogeneous water phase catalysis as an environmental application: a review. Chemosphere. 2002; 48: 1047-1060. https://goo.gl/d6hVH3
- El Hajjouji H, Pinelli E, Guiresse M, Merlina G, Revel JC, Hafidi M. Assessment of the genotoxicity of Olive Mill Waste Water (OMWW) with the Vicia faba micronucleus test. Mutat Res. 2007; 634: 25-31. https://goo.gl/5t1C9W
- Feng X, Guo H, Patel K, Zhou H, Lou X. High performance, recoverable Fe3O4ZnO nanoparticles for enhanced photocatalytic degradation of phenol. Chemical Engineering Journal. 2014; 244: 327-334. https://goo.gl/n69pX4
- Hur SG, Kim TW, Hwang SJ, Hwang SH, Yang JH, Choy JH. Heterostructured nanohybrid of zinc oxide-montmorillonite clay. J Phys Chem B. 2006; 110: 1599-1604. https://goo.gl/ULzAuB
- Ugurlu M, Karaoglu MH. TiO2 supported on sepiolite: Preparation, structural and thermal characterization and catalytic behaviour in photocatalytic treatment of phenol and lignin from olive mill wastewater. Chemical Engineering Journal. 2011; 166: 859-867. https://goo.gl/Qo89iq
- Satish M, Rohan L, Shailesh G, Shachi N, Shirish S, Rajeev C. Continuous flow photocatalytic reactor using ZnO–bentonite nanocomposite for degradation of phenol. Chemical Engineering Journal. 2011; 172: 1008-1015. https://goo.gl/c3wfpx
- Pardeshi SK, Patil AB. A simple route for photocatalytic degradation of phenol in aqueous zinc oxide suspension using solar energy. Solar Energy. 2008; 82: 700-705. https://goo.gl/RLczMV
- Anandan S, Vinu A, Venkatachalam N, Arabindoo B, Murugesan V. Photo catalytic activity of ZnO impregnated Hb and mechanical mix of ZnO/Hb in the degradation of monocrotophos in aqueous solution. Journal of Molecular Catalysis A: Chemical. 2006; 256: 312-320.
- Cofrades S, Salcedo Sandoval L, Delgado Pando G, Lopez Lopez I, Ruiz Capillas C, Jimenez Colmenero F. Antioxidant activity of hydroxytyrosol in frankfurters enriched with n-3 polyunsaturated fatty acids. Food Chemistry. 2011; 129: 429-436. https://goo.gl/WM2DZz
- Obied HK, Bedgood DR Jr, Prenzler PD, Robards K. Bioscreening of Australian olive mill waste extracts: biophenol content, antioxidant, antimicrobial and molluscicidal activities. Food Chem Toxicol. 2007; 45: 1238-1248. https://goo.gl/oow9De
- Bouallagui Z, Bouaziz M, Lassoued S, Engasser JM, Ghoul M, Sayadi S. Hydroxytyrosol acyl esters: biosynthesis and activities. Appl Biochem Biotechnol. 2011; 163: 592-599. https://goo.gl/5mgvQE
- Samuel SM, Thirunavukkarasu M, Penumathsa SV, Paul D, Maulik N. Akt/FOXO3a/SIRT1-mediated cardio protection by n-tyrosol against ischemic stress in rat in vivo model of myocardial infarction: switching gears toward survival and longevity. J Agric Food Chem. 2008; 56: 9692-9698. https://goo.gl/aur7cp
- Wan J, Li H, Kezheng C. Synthesis and characterization of Fe3O4@ZnO core–shell structured nanoparticles. Materials chemistry and Physics. 2009; 114: 30-32. https://goo.gl/kYrk6w
- Baransi K, Dubowski Y, Sabbah I. Synergetic effect between photocatalytic degradation and adsorption processes on the removal of phenolic compounds from olive mill wastewater. Water Res. 2012; 46: 789-798. https://goo.gl/gg2sy9
- Nassar NN, Arar L, Marei NN, Abu Granim MM, Dwekat M, Shadi HS. Treatment of olive mill based wastewater by means of magnetic nanoparticles: Decolourization, dephenolization and COD removal. Environmental Nanotechnology, Monitoring & Management. 2014; 1-2: 14-23. https://goo.gl/kurC8f
Authors submit all Proposals and manuscripts via Electronic Form!


