IgA Nephritis: A comparison of Oxford and Traditional Histological Scores and the Correlation with Clinical Indices in a Southeast Asian population?
Keng T. Woo1*, Cynthia C. Lim1, Marjorie WY. Foo1, Hwai L. Loh2, Yok M. Chin1, Jason CJ. Choo1, Puay H. Tan2, Lina HL. Choong1, Han K.Tan1, Kok S. Wong1 and Choong M. Chan1
1Department of Renal Medicine, Singapore General Hospital, Singapore
2Department of Pathology, Singapore General Hospital, Singapore
*Address for Correspondence: Keng Thye Woo, Level 3 Academia, 20 College Road. Singapore 169856, Tel: +65-6222-3322; Fax: +65-6224-9221; E-mail: woo.keng.thye@singhealth.com.sg
Submitted: 08 May 2017; Approved: 31 May 2017; Published: 31 May 2017
Citation this article: Woo KT, Lim CC, Foo MWY, Loh HL, Chin YM, et al. IgA Nephritis: A comparison of Oxford and Traditional Histological Scores and the Correlation with Clinical Indices in a Southeast Asian population. Int J Nephrol Ther. 2017;3(1): 014-026.
Copyright: © 2017 Woo KT, et al. This is an open access article distributed under the Creative Commons Attribution License, which permits unrestricted use, distribution, and reproduction in any medium, provided the original work is properly cited
Keywords : ESRF; CKD; Glomerular Disease
Download Fulltext PDF
Background: The Oxford Classification of IgAN was developed in 2009. Subsequent validation studies found that M and E lesions were less predictive of ESRD. Varying reproducibility and lack of sufficient clinical relevance have since then resulted in several larger studies like the VALIGA study which addressed some of the shortcomings of the Oxford Classification. We had previously reported on a 30 year follow up study of 102 patients with IgA nephritis (IgAN) to validate the Oxford Classification and we showed that E and S lesions of the Oxford MEST were predictive of patients likely to develop renal failure during the initial 5 years of the disease whereas M and T scores were predictive of late renal failure as shown in our 30 years follow up of these patients. In this follow up study we explore how we could expand the relevant histological features of the MEST score as well as include some clinical indices to make the Oxford Classification more relevant clinically.
Methods: In the present study we compare the Traditional Histological Scores with the Oxford Classification scores as predictors of disease progression to End Stage Renal Disease (ESRD) as well as their correlation with various clinical indices. This is a comparison based on the predictive and prognostic values of the individual histological scores from both classifications as well as to ascertain their association with other histological scores like crescents, global sclerosis and arterial thickening of blood vessels. We also correlated these histological scores with clinical indices like urinary RBC, proteinuria and eGFR to determine the clinical value of each histological score.
Results: We have shown through the use of 3 sets of data (Cox regression, Correlation tests and Cumulative renal survival graphs) that the 4 Oxford scores identify very similar prognostic indicators of disease progression and ESRD with the Traditional scores. Three other histological indices, crescents, global sclerosis and arterial intimal thickening, irrespective of whether linked to Oxford or Traditional scores, both sets of data, provide very similar correlations with one another as well as the clinical indices of RBC, eGFR but not TUP. These were further supported by similarly comparable results between the Oxford and the Traditional scores for the various prognostic histological and clinical indices as shown by data from Cox regression and cumulative renal survival graphs.
Conclusion: To secure an accurate prognostic index of ESRD in IgAN we need to widen the scope of the MEST scores and include other traditional scores like crescents, global sclerosis and arterial intimal thickening of blood vessels as well as clinical indices like urinary RBC, proteinuria and GFR.
Introduction
IgAN is the most common glomerular disease worldwide with ESRD occurring in up to 44% within 30 years [1]. Prevalence, clinical presentation and course of IgAN varies across countries worldwide [2]. This may be contributed by differences in genetic susceptibility [3]. Long term follow data on IgAN have mostly emerged from East Asia [4,5] with less known about long term renal outcome in multi-ethnic Southeast Asia.
In 1985 we studied 151 patients with IgA nephritis (IgAN) to document the natural history and the prognostic indicators after a 5 year follow up and found that 11% had developed End Stage Renal Failure (ESRF) [6]. Subsequently in 2000, 15 years later we did another follow up study and ascertained that 35% of patients had developed ESRF.
With the implementation of the Oxford classification for IgAN in 2009 [7], we performed a 30 year follow up study of these patients in 2015 to validate the Oxford Classification and we showed that E and S lesions of the Oxford MEST were predictive of patients likely to develop renal failure during the initial 5 years of the disease whereas M and T scores were predictive of late renal failure as shown in our 30 years follow up of these patients [1].
Despite the widespread adoption of the Oxford Classification today, some populations have difficulty in validating the MEST scores as some of its features are not readily reproducible resulting in reports with wide variability from different centers [8]. The main value for using renal pathology is its employment in prediction of renal outcome of the patient. Because of differing views with regards to the Oxford Classification [8] we have performed this study which compared the Oxford Classification with the Traditional Classification to determine how far either classification differs in their prognostic scores for ESRD and to explore how we could perhaps enable the Oxford Classification to have a more relevant clinical role in the interpretation of renal histopathology.
In the present study we compare the Traditional Histological Scores with the Oxford Classification as predictors of disease progression to End Stage Renal Disease (ESRD) as well as their correlation with various clinical indices. This is a comparison based on the predictive and prognostic values of the individual histological scores from both classifications as well as to ascertain their association with other histological scores apart from the standard Oxford or MEST scores. We also utilized Cox regression for various histological and clinical parameters as well as compared various cumulative renal survival graphs of the histological indices in relation to progression to ESRD over the 30 years.
Among the 151 patients in the original study in 1985, we managed to retrieve the paraffin tissue blocks for 125 biopsy specimens. In the Oxford Classification, only specimens with at least 8 glomeruli were acceptable, so after excluding these patients with less than 8 glomeruli, we had only 102 patients for the study using the Oxford Classification. For the Traditional Classification, the minimum number of glomeruli was 10.
Material and Methods
For this study, we retrieved 125 stored paraffin blocks from the original cohort. These were sectioned to 1 µm thickness and stained with periodic acid-Schiff (PAS). IgAN was diagnosed in the presence of increased mesangial matrix or mesangial cells by light microscopy, isolated or predominant IgA deposits by immunofluorescence and electron-dense deposits within mesangium by electron microscopy. Patients with liver disease, systemic lupus erythematosus, and IgA vasculitis, as well as specimens containing less than 8 glomeruli, were excluded. All current slides were reviewed by a single pathologist (HLL) blinded to the patients’ clinical data and ESRD outcome. Glomerular and tubulointerstitial lesions were classified according to the Oxford Classification [7], with further characterisation of crescents and arterial intimal thickening. Similarly for the Traditional Histological scores, the equivalent lesions of the MEST Oxford Classification were retrieved from the original biopsy reports performed in 1985 for comparison with the present Oxford Histological scores. Table 1 shows the histological features for the Oxford as well as the Traditional Classification. We have also included global glomerulosclerosis as well as crescents and arterial intimal thickening since these lesions were also included in the Traditional Classification. These 3 lesions were also compared for the Oxford Classification.
Patients’ demographic, clinical and laboratory data, including serum creatinine (in mg/ dL), 24 hour total urine protein (TUP; expressed as g/ day) and urinalysis at presentation and at 5 years post-biopsy, were obtained from patients’ case records [6]. Estimated glomerular filtration Rate (eGFR) was calculated using the CKD-EPI estimation equation [9]. Patients’ presentation was categorized as gross hematuria, isolated microscopic hematuria, hematuria with proteinuria >0.2 g/24 hours and isolated proteinuria. ESRD was defined as eGFR less than 15 ml/min/1.73 m2, or serum creatinine more than 500 μmol/ L or patient received transplantation or chronic dialysis.
Statistical analysis
Statistical analysis was performed using SAS 9.4 (SAS Institute Inc., Cary, NC, USA). Categorical variables are expressed as number (percentage) and compared using Pearson chi-square test or Fisher’s exact test where appropriate. Continuous variables are expressed as mean (± 2SD) and compared using Student’s t-test. Time from kidney biopsy to ESRD was analyzed using survival analysis and cumulative renal survival without ESRD compared using the log-rank test. Cox regression was used to calculate unadjusted and adjusted HR and 95% confidence interval (CI) for (a) clinical factors (b) clinical and histological factors associated with ESRD at 5, 20 and 30 years. All analyses were two-tailed. P values <0.05 were considered statistically significant.
For correlation coefficients, continuous variables of clinical indices like proteinuria and degree of haematuria and eGFR were correlated with the Traditional Histological Indices expressed as percentages of glomeruli showing a particular histological feature like Mesangial proliferation (Mes), Endocapillary (Endo) proliferation, Segmental glomerulosclerosis (Seg Sclero) or Crescents. The Partial Correlation test was used with a number of survival years (up to 30 years) as the controlling factor for correlation between the Traditional Histological scores and clinical indices like proteinuria, haematuria, and eGFR as these are continuous variables.
For categorical variables, the correlation coefficients were derived from the various clinical indices expressed as categories of severity: TUP < 1gm/ day, 1 to 2gm/ day and > 2 gm / day as categories 1, 2, and 3. For Haematuria, RBC <0 to 3 phpf, more than 3 to 20 RBC phpf, more than 20 and to 100 and >100 RBC phpf as categories 0, 1, 2 and 3. For eGFR those with > 60ml/ min were categorised as 1 and those with < 60ml/ min as 2. These clinical indices were correlated with the MEST scores of the Oxford Classification using Kendall’s correlation as well as Spearman correlation coefficients for non-parametric data on the SSPS program. Correlation between the MEST scores and the Traditional Scores were also performed using all 3 tests of Partial Correlation, Spearman and Kendall Correlation to compare the correlation for both sets of Oxford and Traditional scores so as to standardize the procedure as well as for the comparison of the 3 correlation tests. This was shown in a composite table (Table 2).
Results
One hundred and two patients were included in this study. Table 1 shows the histological classification of IgAN and notation for the tables and figures. The demographic, clinical presentation and histology are shown in table 3. Mean age at presentation was 24 ± 7 years and the majority were Chinese (85%) and male (71%). Most patients were normotensive (79%) and had normal renal function with mean eGFR 92 ± 32 ml/min; 15 patients (15%) had eGFR <60 ml/min at presentation. Mean proteinuria was 1.8 (± 2.3) g/ day: 47 patients (46%) had proteinuria >1 g/ day and 24 (24%) patients had proteinuria >2 g/day. A mean number of glomeruli per sample were 20. M1, E1, S1, T1 or T2 and crescents were present in 57%, 4%, 28%, 11.8% and 25% of patients with biopsy-proven IgAN respectively. Arterial intimal thickening was present in 21% and 10% of total glomeruli were globally sclerosed. For Traditional scores, the mean number of glomeruli was 12. Mesangial Proliferation (Mes), Endothelial Proliferation (Endo), Segmental Glomerulosclerosis (Segs Scl), Tubular Atrophy (TA) and crescents were present in 97%, 2%, and 80% 94% and 24%. Arterial intimal thickening (Vess) in 20% and Global Sclerosis (Global Scl) in 13%.
ESRD over 30 years’ follow-up
Cox regression: Table 4 shows the hazard ratio of ESRD at 5, 20 and 30 years based on Cox regression. Among the features analyzed were Clinical variables like renal function, urinary protein, hypertension and RBC counts, followed by the MEST scores of the Oxford Classification and the Traditional Histological variables (shown as the percentage). Fourteen percent (14/102) were in ESRF at the end of 5 years, 39% (40/102) at 20 years and 44% (45/102) at 30 years. At 5 years, Oxford Classification scores for E (p < 0.037) and T (p < 0.0001) were significant, but not the M and S. Mes and Endo scores for Traditional Classification were not significant at 5 years. Based on the Traditional histological scores (percentage scores), both percentage Segmental Sclerosis and percentage Global Sclerosis were significant among ESRF patients, (p < 0.001) and (p < 0.001) respectively. Crescents and Arterial intimal thickening of blood vessels were not significant. Clinical parameters included hypertension (p < 0.02) and proteinuria >1gm/day (p < 0.01)) were significant among patients with ESRF. Microscopic haematuria (RBC >3 phpf) was not significant. The eGFR at presentation was lower among patients with ESRD. (p < 0.02).
At 20 years, only the E (p < 0.025) and T scores (p < 0.0001) of the Oxford Classification were significant. For Traditional Classification, Endo scores and TA scores were also significant (p < 0.021, < 0.01 respectively). Based on the Traditional histological scores, both percentage Segmental Sclerosis and percentage Global Sclerosis were significant among ESRF patients, (p < 0.0001). Crescents and Arterial intimal thickening were not significant. Among the clinical indices, hypertension was more prevalent in the ESRF patients (p < 0.031) together with lower eGFR at presentation (p < 0.004). Similarly at 30 years, only the E (p < 0.048) and T score (p < 0.0001) of the Oxford Classification were significant in the ESRD patients. For the Traditional Classification, Endo scores and TA scores were also significant (p < 0.02, < 0.03). Based on the Traditional histological scores, both percentage Segmental Sclerosis and percentage Global Sclerosis were significant among ESRF patients, (p < 0.001) and (p < 0.01) respectively. Crescents and Arterial intimal thickening were not significant. Among the clinical indices the eGFR at presentation was significantly lower for the ESRD patients (P < 0.0042).
Renal survival
ESRD over 30 years’ follow-up: ESRD occurred in 14 (14%), 40 (39%) and 45 patients (44%) at 5, 20 and 30 years respectively. Mean time from diagnosis to ESRD was 10 ±7 years. The Kaplan-Meier cumulative renal survival curve for the 102 patients with IgAN showed a plateau in the number of renal survivals after 20 years. This graph is not shown here as it was published in our previous paper [1].
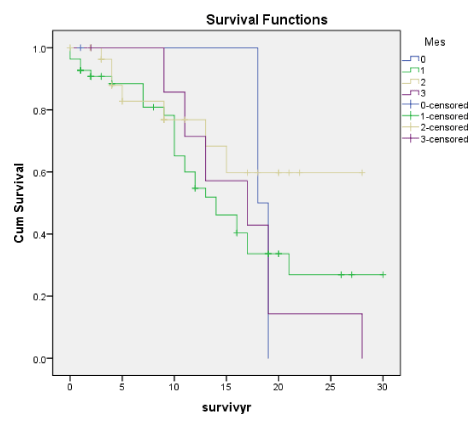
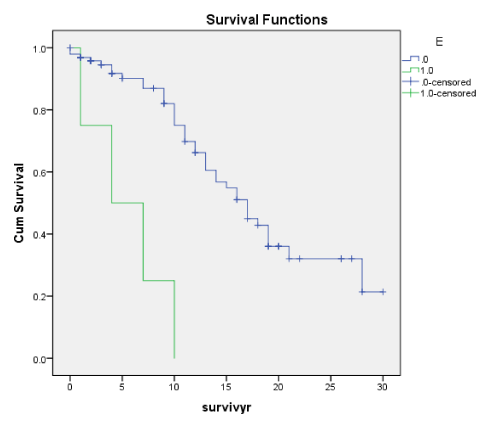
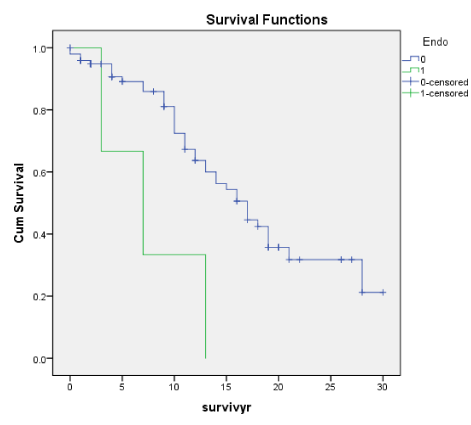
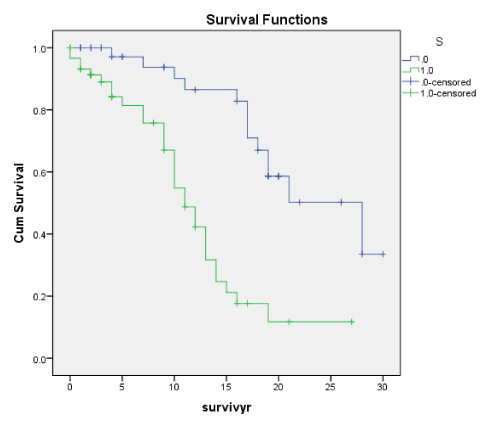
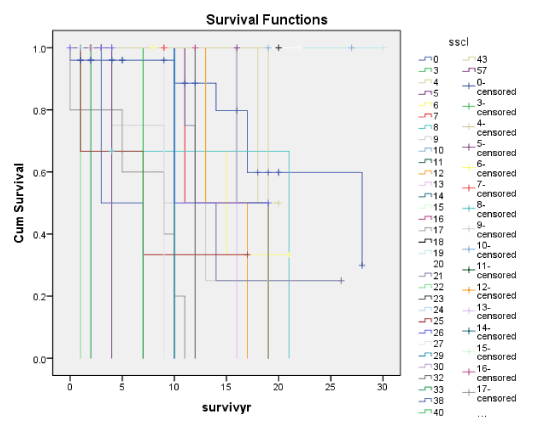
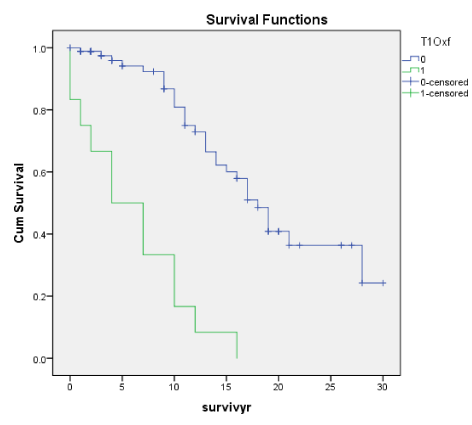
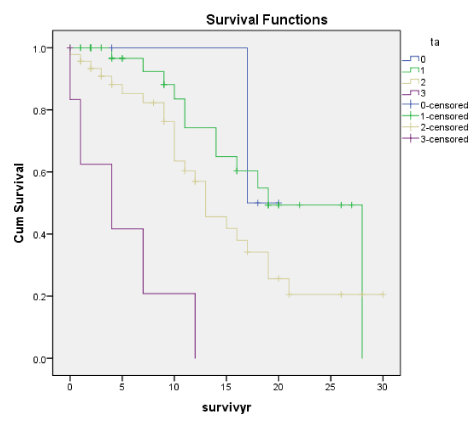
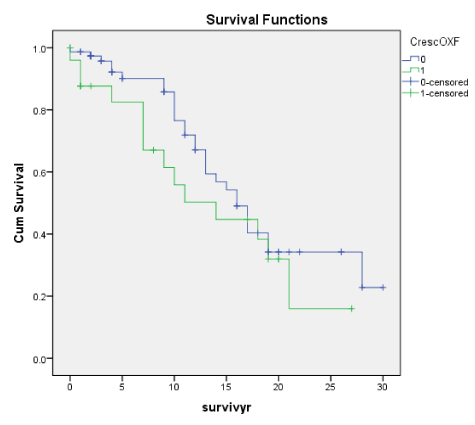
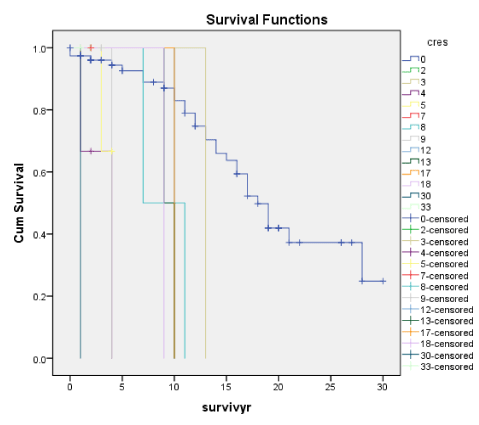
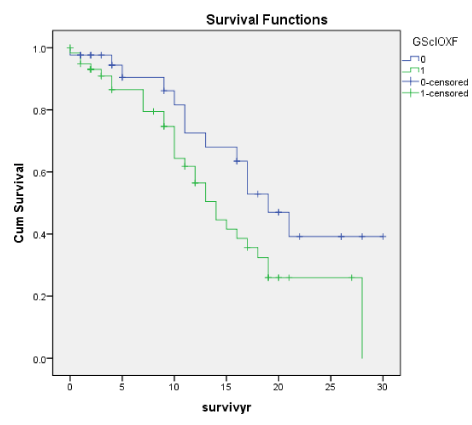
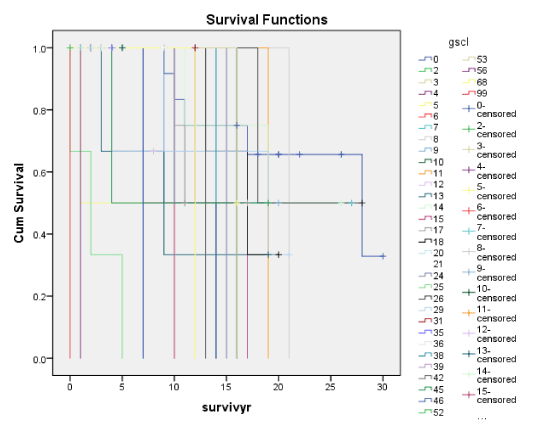
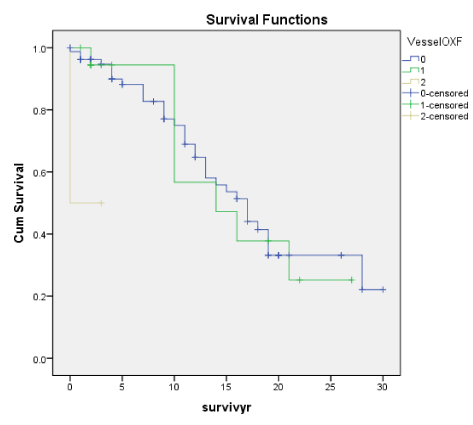
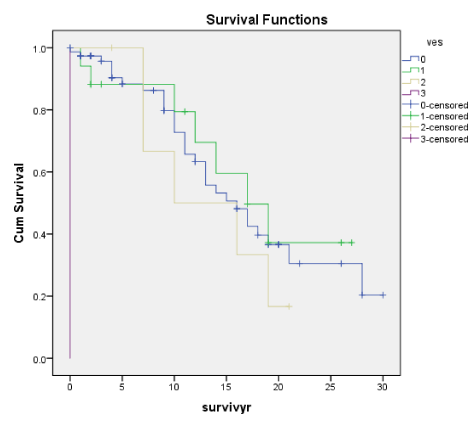
Figures 1A-7A shows Kaplan-Meier renal survival curves for each of the 4 Oxford MEST lesions plus Crescents, Global Sclerosis and Arterial intimal thickening designated as a series and their equivalent for the Traditional Classification designated as B series. For Oxford Classification (Fig 1A-7A), Endocapillary proliferation (E) (log rank p = 0.001), Segmental Sclerosis (S) (log rank p = 0.001) and Tubular Atrophy (T) (p = 0.001), Arterial intimal thickening (p = 0.006) were significantly associated with ESRD. Mesangial proliferation (M) (log rank 0.773), Crescents (p = 0.224) and Global Sclerosis (p = 0.058) were not associated with ESRD.
Figures 1B-7B shows the corresponding Kaplan-Meier renal survival graphs for the Traditional scores for each of the 4 corresponding lesions of Mesangial Proliferation (Mes) (p = 0.427), Endocapillary Proliferation (Endo) (p = 009), Segmental Glomerulosclerosis (Seg Sclero) (p = 0.001), Tubular Atrophy (p = 0.001) plus Global Sclerosis (p = 0.001), Crescents (p = 0.001) and Arterial Intimal Thickening (p = 0.001). The Traditional scores corresponding to the Oxford scores were statistically significant for Endo, Seg Glomerlosclerosis and Tubular atrophy plus Global Sclerosis, Crescents and Arterial Intimal Thickening. The only lesion not significant was Mesangial Proliferation (Mes), consistent with the Oxford M-score. In addition, the Traditional Scores were also significant for Crescents and Global sclerosis. Oxford scores barely missed significance for Global Sclerosis, p < 0.058.
Correlation
Table 2 shows a combination of correlations for Clinical Indices, Oxford and Traditional Classification, all 3 at one glance, a summary or Composite Table.
Kendall correlation: Correlation of Oxford Scores with Clinical Indices (Table of raw data not shown, please refer to Table 2)
M was not correlated with any other parameter.
E correlated with T 0.001, Cresc (Oxford) 0.017, GFR (Oxford) 0.001.
S correlated with T 0.002, Global Sclerosis (Oxford) 0.01, Vessel (Oxford) 0.015, GFR (Oxford) 0.037.
T correlated with E 0.001, S 0.002, Global Sclero (Oxford) 0.013, Vessel (Oxford) 0.041, GFR (Oxford) 0.001.
Global Sclero (Oxford) was correlated with S 0.011, T 0.013, Cresc (Oxford) 0.046, GFR (Oxford) 0.009.
Cresc (Oxford) correlated with E 0.017, Global Sclero (Oxford) 0.046.
Vessel (Oxford) correlated with S 0.015, with T 0.041.
RBC (Oxford) not correlated with any parameter.
TUP was not correlated with any other parameter
GFR Oxford) was correlated with E 0.001, S 0.037, and T 0.001, Global Sclero (Oxf) 0.009.
Partial correlation: Correlation of Traditional Histological Indices with Clinical Indices (Table of raw data not shown, please refer to Table 2).
Mesangial Proliferation (Mes) was not correlated with any other parameter.
Endocapillary Proliferation (Endo) was correlated with Seg Sclerosis 0.001, TA 0.005, Cresc 0.003, Vessel 0.032, TUP 0.009, GFR 0.003.
Seg glomerulosclerosis (Seg Sclero) correlated with Endo 0.001, TA 0.001.
TA correlated with Endo 0.005, Seg Sclero 0.001, GFR 0.007.
Global sclerosis (GS) correlated with TA 0.001, Vessel thickening 0.001, GFR 0.001.
Crescents correlated with, RBC 0.001.
Vessel thickening correlated TA 0.001, GFR 0.001.
RBC correlated with GFR 0.042.
TUP1 correlated with Endo p < 0.009
GFR correlated with Endo p < 0.003 and TA 0.007
Kendall correlation: Correlation between Oxford Scores and Traditional Indices (Table of raw data not shown, please refer to Table 2).
Among the Oxford Scores: M was not correlated with any of the MEST scores or any of the Traditional indices.
E was correlated with T 0.001, Cres (Oxford) 0.017, Seg Scl(Trad) 0.016, TA (Trad) 0.008
S was correlated with T 0.002, Seg Scl (Trad) 0.001, TA (trad) 0.001, Cres (Trad) 0.045
T was correlated with E 0.001, S 0.002, Endo (Trad) 0.001, Seg Scl (Trad) 0.003, TA (Trad) 0.002
Cresc (Oxford) was correlated with Endo (Trad) 0.017, Seg Scl (Trad) 0.001, TA (Trad) 0.012
Among the Traditional Histological Indices: Mes (Trad) was not correlated with any other of the MEST or TRAD scores.
Endo (Trad) was correlated with E (Oxford) (0.001), T (Oxford) (0.001), Cres (Oxford) 0.017, Seg Sclerosis (Trad) 0.016, TA (Trad) 0.008.
Segmental glomerulosclerosis (Seg Sclero) (Trad) was correlated with E (Oxford) 0.016, S (Oxford) (0.001), T (Oxford) 0.003, Cresc (Oxford) 0.001, Endo (Trad) 0.016, TA (Trad) 0.001.
Tubular atrophy TA (Trad) was correlated with E (Oxford) 0.008, S (Oxford) 0.001, T (Oxford) 0.002, Cresc (Oxford) 0.012, Endo (Trad) 0.008, Seg Sclero (Trad) 0.001.
Cresc (Trad) was correlated with S (Oxford) 0.045.
Hence, for the Oxford MEST scores, S was correlated with Seg Sclero (Trad); T was correlated with TA (Trad)
As for Traditional scores, Endo (Trad) was correlated with E (Oxford); Segs Sclero (Trad) was correlated with S (Oxford); TA (Trad) was correlated with T (Oxford) scores.
On the whole, there appear many similarities between the two sets of tests and for each classification. The correlations with other indices are quite close for the various histological indices despite one test being for continuous variables (Partial Correlation) and the other for categorical variables (Spearman).
For the Oxford MEST scores, S was correlated with Seg Sclero (Trad); T was correlated with TA (Trad)
Similarly, for Traditional scores, Endo (Trad) was correlated with E (Oxford); Segs Sclero (Trad) was correlated with S (Oxford); TA (Trad) was correlated with T (Oxford) scores.
Hence, there is a good correlation between E, S and T of the Oxford scores and their counterparts of Endo, Seg Sclero and TA of the Traditional scores.
The Clinical Indices seem better correlated with the Traditional scores compared to the Oxford Classification. Comparing the histological indices there is a good correlation between the Oxford and the Traditional scores, especially in relation to M and the Mes scores where both showed no correlation with any other parameter. For the rest of the scores like E, S and T with Endo, Seg Sclero and Tubular Atrophy both sets of scores, Oxford and Traditional, were fairly consistent with the other correlating parameters.
It is interesting with the added histological scores like Global sclerosis, Crescents and Arterial intimal thickening to both classifications, which were not in the original Oxford Classification, these additional scores to the Oxford scores were significantly more prevalent among patients with ESRD.
TUP was found to be an index of early progression to ESRD in Cox regression during the first 5 years (Table 4) and was significantly correlated with Endocapillary Proliferation (Endo) and Global Sclerosis., both showing that such patients have early ESRF within 10 years of disease in the Kaplan-Meier renal survival graphs. Similarly, RBCs were correlated with crescents in the Traditional scores but not in the Oxford scores. Our present data would seem to suggest that the Traditional scores are better correlated with various clinical indices like TUP and RBCs.
Table 5 shows a summary of scores with clinical and histological indices for Oxford and Traditional Classification as indicators for the development of ESRD, One (1) denotes a positive score for development of ESRD and 0 is the converse. From the table, a scoring system comprising additional features of crescents, global sclerosis, and arterial intimal thickening as well as clinical data like haematuria, proteinuria, eGFR would make the scores of the Oxford Classification comparable with that of the Traditional Classification. The MEST scores by themselves would otherwise appear to be limited.
Discussion
A previous study by Park, et al. [10] compared the Haas and the Oxford Classification and concluded that the two classifications were comparable in predicting progression of IgAN. Their primary end point was a doubling of serum creatinine and when clinical factors like eGFR and proteinuria were added the predictive values of the classifications were higher than that of the clinical factors alone. Barbour, et al. [11] also reported that by adding the MEST scores to clinical data available at time of biopsy (BP, proteinuria and eGFR) also improve the risk stratification and predictive value of the MEST scores. He concluded that a combination of MEST scores with BP, proteinuria and eGFR at the time of biopsy predicted composite renal outcome similar to using clinical data over two years follow-up.
The VALIGA study by Coppo, et al. [12], included 1147patients from 13 European countries and was conceived to validate the Oxford Classification of IgAN in cohorts with different presentations and treatments. This was because by design the Oxford study did not include the whole spectrum of cases encountered in clinical practice. It did not include the great majority of patients with IgAN who had normal renal function and mild proteinuria. At the other end of the spectrum, it did not include patients with low eGFR. In addition, there were various geographical and racial populations which could not reproduce the results of the Oxford Classification [7,12]. A study by Choi, et al. [13] from Korea found no predictive value of the MEST scores in their patients who had received steroids and immunosuppressive treatment. There is a risk of over-interpreting the data from previous studies as they were all retrospective studies with uncontrolled doses, time of initiation and duration of therapies in various populations versus those not on any treatment at all. There was no real data on natural history as authors claim their studies represent nowadays clinical practice rather than any controlled studies. Hence, the VALIGA study was initiated to address different presentations and treatments in a European cohort. The authors of the VALIGA study concluded that the MEST score has to be considered in the light of both the clinical features, including levels of proteinuria and eGFR values and the treatments given before renal biopsy. It also demonstrated that the post-biopsy therapeutic maneuvers are likely to modulate some of the pathologic risk factors.
We have reviewed 3 sets of evidence with respect to the Oxford versus the Traditional Histological features to identify them as prognostic indicators as well as a guide to disease progression and made a comparison between these two histological classifications. The strengths of this study include evaluating the outcomes of the natural evolution of IgAN without influence by RAS blockade or immunosuppressive therapy during the first 5 years. Another is the long-term follow-up duration for a disease known to be slowly progressive in nature. However its retrospective nature and our attempts at using various correlation statistical tests to compare categorical with continuous variables may result in bias.
M (Oxford) and Mes (Traditional) as in Mesangial proliferation both consistently show no difference between ESRD and non-ESRD patients. Both M and Mes do not correlate with any of the other histological or clinical indices of progression and in terms of cumulative renal survival, short-term, up to 5 to 10 years and for long term up to 30 years there was no significant difference for either M or Mes, both features showing a close identity in their non association with other histological and clinical indices. This is an interesting feature because, in our previous publication [1], M was reported as a significant long term prognostic feature of ESRD based on multivariate analyses, a feature we could show because of our long duration of the study. Most Asian studies were unable to provide supportive evidence of the role of M. However in our present report, we were unable to find a prognostic role for M in our cohort despite the long duration of observation. Even though M is considered an adverse prognostic long term indicator in many series [7,14-19], apart from the Asian series of Zeng [18], most other Asian series could not find a correlation between M and ESRD [10,15,20].
E (Oxf) and Endo (Trad) as in Endothelial Proliferation consistently show a close correlation with other histological features of early progression and early ESRD (within 5 to 10 years). For both E and Endo, there was a close correlation with Segmental glomerulosclerosis (Seg Sclero), crescents (Cres), tubular atrophy (TA) as well as arterial thickening of blood vessels (Vess). There was also the correlation with clinical indices of activity like RBC and declining renal function (eGFR) but no correlation with proteinuria (TUP) on the whole apart from an isolated correlation between TUP and Endo (Trad). For both E and Endo, many patients with these lesions were in ESRD by 10 years and E and Endo can be considered early predictors of disease progression and risk of ESRD.
In our previous report [3] we showed that both E and S like Endo and Segmental Sclerosis (Seg Scl) were associated with lower eGFR at presentation and doubling of serum creatinine. These were referred as “early disease activity predictors.” [21,22].
S as in S (Oxf) and Seg Sclero (Trad) are also early indicators of poor prognosis and risk of developing ESRD. In our earlier paper [1] there were more patients with these lesions who had eGFR < 60ml/min and the higher incidence of ESRD eventually. This is shown in the Cox regression for Seg Scl (Trad) lesion but not for S (Oxf) lesion. E and S are correlated with Endo and Seg Scl, Tubular atrophy (TA), Global Sclerosis (Glob Scl), Cresc and arterial thickening of the blood vessel (Vess) as well as RBC and lower eGFR. Cumulative renal survival shows both S and Seg Sclero have a higher prevalence of ESRD by 10 years. In Coppo’s study [17], S was associated with renal non survivors (ESRF). This is in agreement with our present data.
T (Oxf) and TA (Trad) as in Tubular Atrophy/interstitial fibrosis is an important prognostic index for ESRD throughout the 30 years but more so as a late predictor as shown in the Cox regression where there was significance at 20 and 30 years for Traditional scores but significant at 5, 20 and 30 years for the Oxford scores. On the basis of the cumulative renal survival graphs, both T and TA were significant predictors of ESRD., closely correlated with S and Segmental Sclerosis, Global Sclerosis and Arterial intimal thickening but not RBC, eGFR or TUP. Various workers worldwide are in agreement that T and TA are both short and long term predictors of ESRD [1,13,14,16,17,19,21,23,24].
Other scores
Crescents for both the Oxford and Traditional scores as well as by Cox regression were not significant predictors of ESRD, but with the cumulative renal survival graphs for the Traditional score, crescents were significantly associated with ESRD (p < 0.001) though not with the Oxford score (p = 0.244). Also, crescents were closely correlated with E and Endo and T scores, RBC and eGFR decline but not with TUP. In fact, for many studies among the Oxford scores, Crescents were not significantly associated with ESRD except for a series from China by Zeng, et al. [18] who found an association between the presence of crescents and TUP.
In our recent paper [1] we had shown that crescents were not associated with ESRD, but our earlier study of the original cohort of 151 patients [6], based on traditional scores we reported that Crescents was a significant adverse prognostic indicator with respect to ESRD. In some even more recent studies [25,26], crescents were found to be a significant adverse predictor and the authors managed to link Crescents as another important score of the Oxford Classification [25,26]. Crescents though found by Katafuchi [23] and Halling [24] to be poor prognostic indicator of ESRD. Many other workers like Shi [20] and Lee [21], despite the presence of crescents in large numbers of their patients, could not find a poor prognostic significance for crescents in their cohorts, though many other series attributed this to the low prevalence of crescents in their cohorts.
In a recent update from the workgroup of the Oxford Classification, Trimarch, et al. [26] reported that in a larger, more broad based cohort than the original Oxford Study, Crescents (C) are predictive of outcome and they now recommend that C be added to the MEST score and biopsy reporting should provide a MEST-C score. In another report of a multicenter study of the predictive value of Crescents in IgAN by Haas, at al. [25], in a series pooled from 4 retrospective studies, involving 3016 subjects, crescents were associated with ≥ 50% decline in eGFR or ESRD. Among these subjects the median proteinuria was 1.2 gm/day and 36% had cellular or fibrocellular crescents. The authors proposed adding the following crescent scores to the MEST scores: C0 (no crescents), C1 (crescents in less than one-fourth of glomeruli) and C2, (crescents in over one-fourth of glomeruli), to identify patients at greater risk of progression, even with immunosuppression.
Arterial intimal thickening (Vess) though not significant on Cox regression was a significant predictor of ESRD on the basis of cumulative renal survival curves both for Oxford and the Traditional scores. In our earlier work [27], we had documented that Arterial Thickening of blood vessels (Vess) was associated with ESRD. In this present study, Arterial intimal thickening (Vess) was correlated with Endo, S and T well as RBC and deline in eGFR. Nasri, et al. [28] reported the significance of vasculopathy in IgA nephropathy and in an evaluation of Oxford scores found a significant correlation of the scores of arterial intimal fibrosis with serum creatinine and degree of proteinuria.
Global Sclerosis was significantly associated with ESRD for both the Oxford and the Traditional scores on Cox regression. But with the cumulative renal survival graphs, Global Sclerosis has a significant association with ESRD in the Traditional scores (p < 0.001) but not the Oxford scores (p < 0.058). Global sclerosis was correlated with S and Seg Scl together with T and Cresc. For clinical indices, only TUP (Oxford score) was correlated with Global Sclerosis using Kendall correlation as shown in table 2. These data confirmed that histological features of chronic damage such as T lesions and extent of Global Sclerosis were most strongly associated with long term ESRD, regardless of geography or ethnicity [10,16-18,21,22,29,30].
We have shown through the use of 3 sets of data (Cox regression, Correlation tests and Cumulative renal survival graphs) that the 4 Oxford scores identify very similar prognostic indicators of disease progression and ESRD with the Traditional scores. Three other histological indices, Crescents, Global Sclerosis and Arterial intimal thickening, irrespective of whether linked to Oxford or Traditional scores, both sets of data, provide very similar correlations with one another as well as the clinical indices of RBC, eGFR but not TUP. These were further supported by similarly comparable results between the Oxford and the Traditional scores for the various prognostic histological and clinical indices as shown by data from Cox regression and cumulative renal survival graphs.
However, while both Oxford and Traditional scores are comparable, the two sets of scores are not totally correlated. There was no direct correlation between the MEST and the Traditional scores, perhaps because the Oxford scores are categorical whilst the Traditional scores are continuous variables and therein lies the difference when one compares apples to oranges though both are fruit. With our use of 3 different statistical correlation coefficients and transforming the Traditional score into categorical scores and using Kendall correlation for both sets of scores as well as the use of partial correlation for both sets including Spearman correlation (non parametric correlation) again for both sets, we showed that the scores for both sets of Oxford and Traditional data had very similar correlation among the other various histological and clinical indices, but we still cannot categorically report that both the Oxford and the Traditional Scores were directly and totally correlated, not among themselves, i.e. M,E,S.T versus Mes, Endo, Seg Scl, TA. At best, using 3 types of correlation tests we managed to explore the similarities amongst the shared and commonly associated prognostic histological and clinical indicators of disease progression between these two classifications.
The present Oxford Classification may not be clinically relevant for all populations across the globe as certain features of the MEST scoring are not suitably reproducible and their correlation with the renal outcome uncertain. The limited range of histological scoring of MEST has excluded other essential histologic features like crescents, global sclerosis and arterial intimal thickening. In order to be clinically relevant the MEST scores should be expanded and considered together with clinical indices like haematuria, eGFR, proteinuria and hypertension.
Conclusion
Both sets of Oxford and the Traditional scores though showing no direct correlation between MEST versus Mes, Endo, Seg Sclerosis and TA of the Traditional scores on Partial Correlation, Kendall and Spearman correlation, they nevertheless showed similar correlations with various other histological and clinical indices relating to progression to ESRD. The cumulative renal survival graphs also showed similar trends for ESRD. Other Traditional scores, scores like Crescents, Global sclerosis and Arterial intimal thickening, though not classified as Oxford scores also shared some common trends with the Oxford scores.
This is also bourne out by Cox regression showing E,S and Endo, Seg Sclero as early prognostic indicators and T, TA, Global sclerosis and Arterial intimal thickening as late predictors. Both sets of scores also showed no significance for M and Mes. Crescents were significant only for the Traditional scores and TUP mostly showed no correlation with other parameters, though Crescents have recently been admitted amongst the MEST scores of the Oxford Classification as MEST- C [25,26].
Disclosure
The authors have no financial interests in the information contained in the manuscript. The study was approved by the local Institutional Review Board (Reference number 2015/2556).
- Woo KT, Lim Cynthia, Foo Marjorie WY, Loh HL, Jin AZ, Chin YM, Choo Jason CJ, Tan PH, Chow KY, Choong Lina HL, Tan HK, Wong KS, Chan CM: 30 year follow up study of IgA nephritis in a Southeast Asian population: an evaluation of the Oxford histological classification. Clinical Nephrol 2016, 86(5); 270-278. DOI 10.5414/CN 1088919. https://goo.gl/9UtC1Q
- Woo KT, Edmondson RP, Wu AY, Chiang GS, Pwee HS, Lim CH: The natural history of IgA nephritis in Singapore. Clin Nephrol. 1986, 25(1): 15-21. https://goo.gl/wF26Hp
- Cattran DC, Coppo R, Cook HT, Feehally J, Roberts IS, Troyanov S, Alpers CE, Amore A, Barratt J, Berthoux F et al: The Oxford classification of IgA nephropathy: rationale, clinicopathological correlations, and classification. Kidney Int. 2009, 76(5): 534-545. https://goo.gl/92IF2p
- Haas M, Rastaldi MP, Fervenza FC. Histologic Classification of glomerular diseases: clinicopathologic correlations, limitations exposed by validation studies and suggestions for modification. Kidney Int, 2014, 85: 779-793. https://goo.gl/PYgjmL
- Levey AS, Stevens LA, Schmid CH, Zhang YL, Castro AF, 3rd, Feldman HI, Kusek JW, Eggers P, Van Lente F, Greene T et al: A new equation to estimate glomerular filtration rate. Annals Int Med. 2009, 150(9): 604-612. https://goo.gl/ZHXu1Q
- Park kS, Han SH, Kie JH, Nam KH, Lee MJ, Lim BJ, Kwon YE, Lik YL, An SY, Kim CH, Doh FM, Koo HM, Oh HJ, Kang SW, Choi KH, Jeong HJ, Yoo TH. Comparison of the Haas and the Oxford classifications for prediction of renal outcome in patients with IgA nephropathy. Human Pathology, 2014, 45: 236-243. https://goo.gl/mG8aLm
- Barbour SJ, Espino-Hernandez G, Reich HN, Coppo R, Roberts ISD, Feehally J, Herzenberg AM, Cattran DC, For the Oxford Derivation, North American Validation and VALIGA Consortia. The MEST scores provides earlier risk prediction in IgA nephropathy. Kidney Int 2016, 89:167-175. https://goo.gl/wE8LNb
- Coppo R, Troyanov S, Bellur S, Cattran D, Cook HT, Feehally J, Roberts SD, Morando L, Camilla R, Tesar V, Lunberg S, Loreto G et al, on behalf of the VALIGA study of the ERA-EDTA Immunonephrology Working Group. Validation of the Oxford Classification on IgA nephropathy in cohorts with different presentations and treatments. Kidney Int, 2014, 86: 828-836. https://goo.gl/2GpxEz
- Choi S, Lee D, Jeong KH Moon JY, Lee SH, Lee TW, Ihm CG. Prognostic relevance of clinical and histological features in IgA nephropathy treated with steroid and angiotensin receptor blockers. Clinical Nephrol 2009; 72: 353-359. https://goo.gl/5mrymx
- Lv J, Shi S, Xu D, Zhang H, Troyanov S, Cattran DC, Wang H: Evaluation of the Oxford Classification of IgA nephropathy: a systematic review and meta-analysis. Amer J Kidney Dis. 2013, 62(5): 891-899. https://goo.gl/mrleQD
- Tanaka S, Ninomiya T, Katafuchi R, Masutani K, Tsuchimoto A, Noguchi H, Hirakata H, Tsuruya K, Kitazono T: Development and validation of a prediction rule using the Oxford classification in IgA nephropathy. Clin J Amer Soc Nephro. 2013, 8(12): 2082-2090. https://goo.gl/J1zAx3
- Kang SH, Choi SR, Park HS, Lee JY, Sun IO, Hwang HS, Chung BH, Park CW, Yang CW, Kim YS et al: The Oxford classification as a predictor of prognosis in patients with IgA nephropathy. Nephrol Dial Transpl. 2012, 27(1): 252-258. https://goo.gl/F5hrbO
- Coppo R, Troyanov S, Bellur S, Cattran D, Cook HT, Feehally J, Roberts IS, Morando L, Camilla R, Tesar V et al: Validation of the Oxford classification of IgA nephropathy in cohorts with different presentations and treatments. Kidney Int. 2014, 86(4): 828-836. https://goo.gl/TPx1UQ
- Zeng CH, Le W, Ni Z, Zhang M, Miao L, Luo P, Wang R, Lv Z, Chen J, Tian J et al: A multicenter application and evaluation of the Oxford classification of IgA nephropathy in adult Chinese patients. Amer J Kidney Dis. 2012, 60(5): 812-820. https://goo.gl/rJPJwV
- Sadeghipour A, Hendi A, Asgari M, Sotoudeh M, Parvin M, Filip I, Radfar A, Babaheidarian P. Validation of Oxford Classification of Immunoglobulin A Nephropathy: an Iranian Experience. Iran J Kidney Dis 2016; 10 (1): 17-21. https://goo.gl/EezwpJ
- Shi SF, Wang SX, Jiang L, Lv JC, Liu LJ, Chen YQ, Zhu SN, Liu G, Zou WZ, Zhang H et al: Pathologic predictors of renal outcome and therapeutic efficacy in IgA nephropathy: validation of the Oxford classification. Clin J Amer Soc Nephrol. 2011, 6(9): 2175-2184. https://goo.gl/tKGci3
- Lee H, Yi SH, Seo MS, Hyun JN, Jeon JS, Noh H, Han DC, Hwang SD, Jin SY, Kwon SH: Validation of the Oxford classification of IgA nephropathy: a single-center study in Korean adults. Korean J Int Med. 2012, 27(3): 293-300. https://goo.gl/GMXTOU
- Yau T, Korbet SM, Schwartz MM, Cimbaluk DJ: The Oxford classification of IgA nephropathy: a retrospective analysis. Amer J Nephrol. 2011, 34(5): 435-444. https://goo.gl/hLDdXO
- Katafuchi R, Ninomiya T, Nagata M, Mitsuiki K, Hirakata H: Validation study of Oxford classification of IgA nephropathy: the significance of extra capillary proliferation. Clin J Amer Soc Nephrol. 2011, 6(12): 2806-2813. https://goo.gl/b39STe
- Edstrom Halling S, Soderberg MP, Berg UB: Predictors of outcome in paediatric IgA nephropathy with regard to clinical and histopathological variables (Oxford classification). Nephrol Dial Transpl. 2012, 27(2): 715-722. https://goo.gl/ufAc3b
- Haas M, Verhave JC, Liu ZH, Alpers CE, Barrat J, Becker JU, Cattran D, Cook HT, Coppo R, Feehally J, Pani A, Perkowska-Ptasinska A, Roberts IS, Spares MF, Trimarch H, Wang S, Yuzawa Y, Zhang H, Troyanov S, Katafuchi R. A multicenter study of the predictive Value of Crescents in IgA Nephropathy. J Am Soc Nephrol 2016, pil; ASN. 2016040433. [Epub ahead of print]. https://goo.gl/7lOUxW
- Trimarch H, Barrat J, Cattran DC, Cook HT, Coppo R, Haas M, Liu ZH, Roberts ISD, Yuzawa Y, Zhang H, Feehally J, on behalf of the IgAN classification Working group of the International IgA Nephropathy Network and the Renal Pathology Society. Oxford Classification of IgA nephropathy 2016-the role of crescentic lesions: an update from the IgA Nephropathy Classification Working Group. Kidney Int DOI. http://dx doi. Org/10.1016/j. kint. 2017.02.003. https://goo.gl/yNs9XW
- Woo K-T, Lau Y-K, Choong LHL, Zhao Y, Tan H-B, Cheung WW, Yap H-K, Chiang GSC: IgA nephropathy: effects of clinical indices, ACEI/ATRA therapy and ACE gene polymorphism on disease progression. Nephrol. 2002, 7: S166-S172. https://goo.gl/h4WDA3
- Nasri H, Mubarak M. Significance of vasculopathy in IgA nephropathy patients with regard to Oxford classification and Immuno staining findings: a single center experience. J Renal Inj Prev 2013; 2(2): 41-45. https://goo.gl/pdU8EV
- Maixnerova D, Bauerova L, Skibova J, Rysava R, Reiterova J, Merta M, Honsova E, Tesar V: The retrospective analysis of 343 Czech patients with IgA nephropathy--one centre experience. Nephrol Dial Transpl. 2012, 27(4): 1492-1498. https://goo.gl/sSnVpc
- Herzenberg AM, Fogo AB, Reich HN, Troyanov S, Bavbek N, Massat AE, Hunley TE, Hladunewich MA, Julian BA, Fervenza FC et al: Validation of the Oxford classification of IgA nephropathy. Kidney Int. 2011, 80(3): 310-317. https://goo.gl/om9zuU


Sign up for Article Alerts